- Will Wall Street see a “Santa Claus Rally” this year?
[Note: this article serves as “Part II” to the previous article… https://www.markettamer.com/blog/holiday-bull-or-bear ]
I am sitting in front of my laptop (sipping a Peppermint Mocha Frappuccino from Starbucks (SBUX)) remembering all the things that we were assured “would never happen”, including:
1) “School-backed mortgages for the professors will be totally safe because housing prices will never go down.” (Dean of Faculty: 2006)
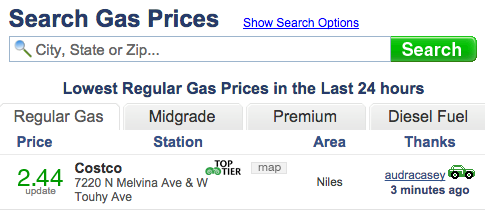
2) “Because of ‘Peak Oil’, we’ll never again see gas prices in Chicago under $2.50!” (MBA class, teacher, 2007). Here is the lowest gas price on 12/12/14:
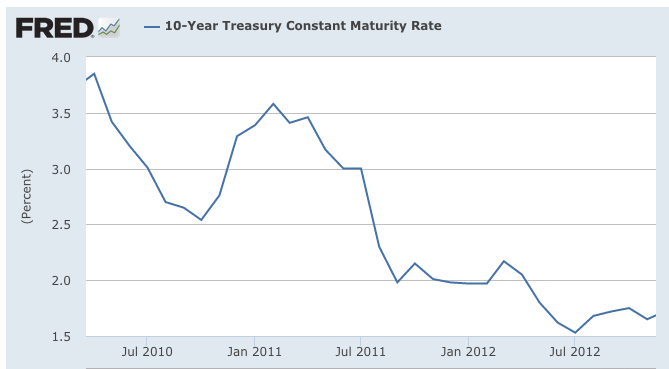
3) “With interest rates at historic lows, rates only have one way to move — UP, UP, UP.” (Financial experts in December 2011, looking ahead to 2013…).
4) “With the U.S. Federal Reserve set on ‘Tapering’, beware of bonds in 2014 because rates are going UP, not down.” (Financial experts in December 2013 looking ahead to 2014.)
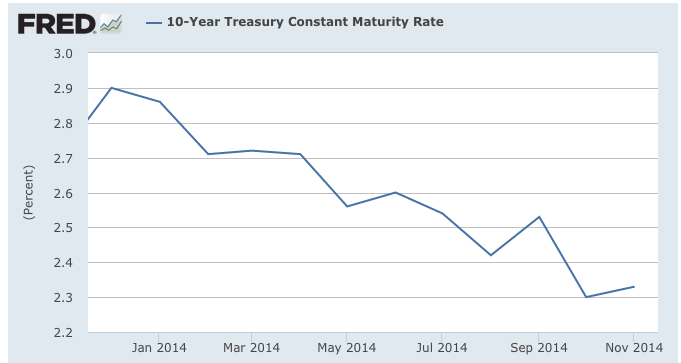
So much for all the experts who were certain that Fed "Tapering" meant rates would go UP during 2014.
Can you imagine what I was thinking as I was staring at my screen during trading hours on Friday, December 12th??
Yes… I was lecturing myself in the strictest[1] of terms as follows: “Never believe what ‘experts’ say about anything!!”[2]
The other timely truth of which I was reminded on that Friday was: “Beware what you wish for…!” As with many other folks, when gasoline prices soared over $4.00/gallon in Chicago, I started hoping (rather fervently) for lower gas prices.[3] However, all I wanted was a gentle dip back into the mid $3/gallon range. I absolutely did not want the financial markets to experience something akin to anaphylactic shock.[4]
I have begun this article in this manner as a hybrid form of “Investor Takeaway/Disclosure”. I will be delving into what a number of “experts” have observed about the financial markets during this time of year. These experts may prove to be correct or they may prove to be far off the mark – that will be for you to discern (and for time to (within just 5 more months) to reveal)!
BEAR TURNS BULL
In using that phrase… I am not referring to some new technology that can literally transform a bear into a bull. Instead, I want to pose this question to you:
“If I told you that a well-known British-born financial management executive who is best known for his bearish views on the market has recently publicly proclaimed his strongly bullish view on equities between now and the end of April in 2015[5] – what would you think?”
Now I implore you to consider this question very carefully! See if you can guess why this expert feels bullish! Then once you’ve worked out an answer … came right back here and finish reading this article… OK?[6]
IS THERE A SANTA FOR THE MARKET?
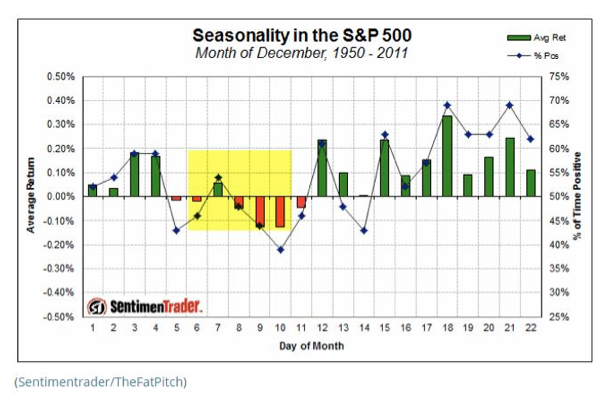
Take a look at this fascinating graph of December price action (isolated by “day of the month” in each year) over the 61-year period between 1950 and 2011.
By the time you read this, we will have entered (trading wise) into the second half of December. But even with only half the month left in front of us… this is the kind of graph we need to see after a week like we’ve just suffered through!! Here is some more detail related to this graph:
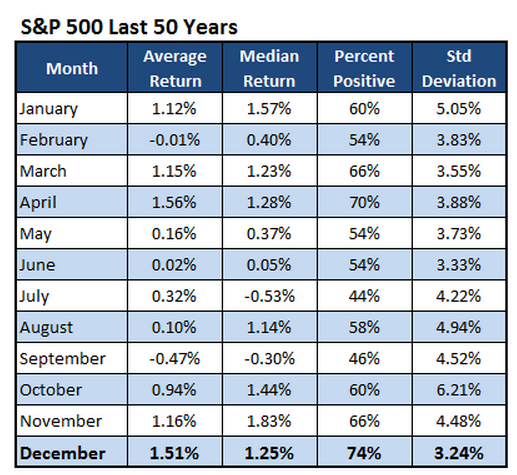
“[December is the] second best month (April is first) in terms of the typical return, with an average gain of 1.51%, and it has been positive more often than any other month, at 74%. Furthermore, the standard deviation of returns [for December] is the lowest, indicating less variation in the returns.”
But (as they say during all those ads for products … “available only on TV”…) that’s not all, folks! Here’s some more:
From Todd Salamone (Sr. V.P. Research) at Schaeffer Investment Research, here is a different view of a very similar data set:
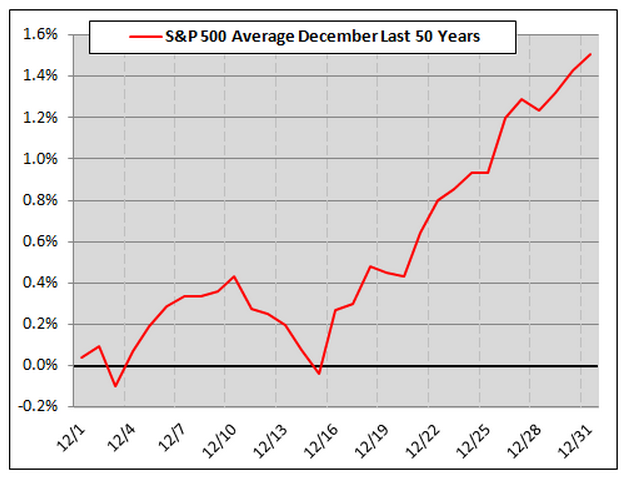 In order for us to easily grasp a much fuller picture of December market history, Mr. Salamone moved on to present a very similar data set in a different format… offering us a chart with market investment return aggregated on a month-by-month basis over 50 years:
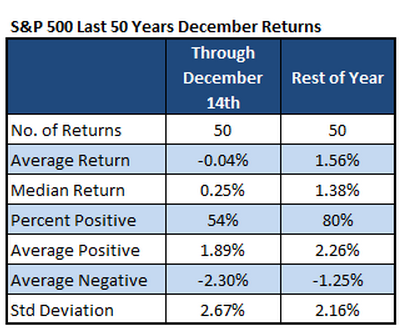
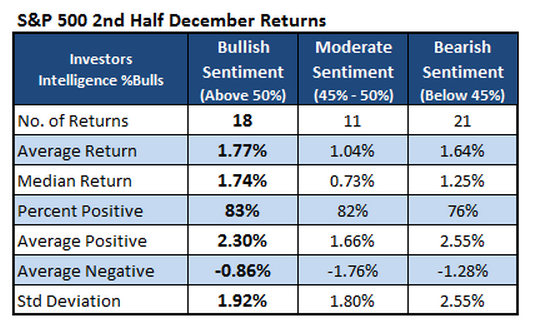
However, just as with December of 2014, equity returns in December have not been universally positive. Specifically, returns through the first half of December have been much less than scintillating!! (An average return of -.04%)
However, here is where a “Stock Santa” comes into the picture!! Look at the average stock market return from December 15-31: [An average market return of 1.77%]
In a December 2nd article from Business Insider (by Myles Udland), the floor governor of the NYSE (Rich Barry) was quoted regarding how the average floor trader was feeling (at that time) about stock returns moving into 2015. According to Mr. Barry:
“… a few seasoned veteran floor-denizens dusted off their editions of the Stock Traders Almanac (for historical patterns)… Hold on to your helmets, because you might be surprised by some of their findings.”
To bring the rest of us up to speed, author Udland itemizes for us the data from the Stock Traders Almanac that excited the traders:
1) 2015 will encompass most of the best performing period within the well-known 4-year “Presidential Cycle”… a cycle that is even better during the second term of a president!
a) Since 1939, the third year within that “Cycle” has provided a 16% return in the Dow Index and 16.3% return from the S&P 500 Index.
2. In case that isn’t good enough for you, data from the Almanac indicates that during years (such as 2015) that end with the number “5”, there has only been one negative “Presidential Cycle” return within the past thirteen decades!
3. [A bonus metric:] During the past 84 years there have only been three times during which equity markets have been up by double digits over 3 consecutive years (2014 will hopefully be a “third in a row”). Following each of those “three consecutive winners”… the fourth year was up an average of 23.1%.
4. [Now the piece de resistance:] Since 1932, the stock market return in this “third year” within the “Cycle”] has experienced just one loss, and that was less than 1%. So if you include dividends and consider the market’s “total return”… even that year was not a “loser”!!
So how/where does the “bearish” investment manager to whom I referred much earlier come into the picture?

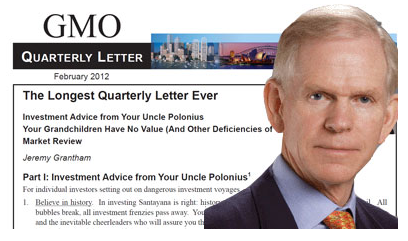
Jeremy Grantham is co-founder of (and currently the Chief Investment Strategist for) GMO in Boston, MA.
Actually, that “bearish” expert is the one who many consider to be the one who discovered and popularized the “Presidential Cycle Indicator”. His name is Jeremy Grantham, born in Great Britain, who co-founded (and serves as Chief Investment Strategist at) Boston-based asset manager Grantham Mayo van Otterloo (aka GMO). Please note that, whether or not you have ever hear of GMO (or Grantham)… it is an international asset management leader, having grown from its 1977 founding into a firm that manages over $117 billion for wealthy clients and institutions! In addition to being widely appreciated among (and recognized by) leaders within the financial press, Grantham was named by Bloomberg Markets as one of the “50 Most Influential” money managers in 2011 – an award determined by the nomination and vote of Bloomberg news journalists from its 150 news bureaus around the world.[7]
During an interview with Bloomberg Businessweek in 2012, Grantham trumpeted the metrics of this indicator:
“Going back to 1932, if you take the first and second year [of a presidential term] together, they've had no real return in the market.”
When Grantham analyzed all the numbers from all years since 1932, this is what he found:
|
YEAR |
U.S. Stock Market Return |
% Of Losing Years |
| 1st Year |
-0.7% |
50% |
| 2nd Year |
-3.3% |
50% |
| 3rd Year |
26.2% |
5% |
| 4th Year |
6.9% |
20% |
Grantham moved on to offer some additional important details:
1) Grantham considers that the “third year” in the cycle actually begins in October rather than January (because it is just after the end of Q3 within the fiscal calendar).
a) Therefore, our current “third year” began two months ago in October of 2014)
2) The largest share of “third year” gains have been seen between October and April.
Building upon all the research referred to above, Grantham wrote the following in his regular Quarterly Letter to clients:
“The results since 1964 of just holding from October 1 of the second year, and selling the following April, is that in 7 months you make almost all the returns of the 48-month cycle.”
Here is a part of Grantham’s story that I find of particular interest. If this “Presidential Cycle Indicator” is so powerful… why don’t we hear more about it? Or alternatively, why don’t all our market gurus just tell us some variation on the following:
“Do you want ‘in’ on a dirty little secret’? Invest in U.S. stocks (S&P 500 Index) on October 1st when it is the start of a ‘third year’ within the “Presidential Cycle’. Then sell on the following April 30th. Then put your money in T-bills… You’ll have it ‘made in the shade’. Remember, you heard it from me first!”
Instead of blowing off or marginalizing the question of why this Indicator is not more widely utilized, Grantham has answered the question thoughtfully and very credibly. In fact, Grantham admits that even he (despite mathematically confirming the data behind the “Cycle”) was extremely skeptical about this “Cycle” strategy in those early years. He explained by offering the following personal observation:
“They felt hokey and insubstantial 35 years ago, and another very good 35 years of performance has not changed that. Managers seem embarrassed to talk about these factors, and clients are reluctant to consider them. And this of course is the point: they carry career risk for professionals as being seen as trivial, and for clients just too simple to be true.”
I know that the above is a lot to absorb. But let me now add one major piece (and crucial piece) of extremely pertinent information for you regarding Grantham’s “market opinion”.
Trust me, this added insight should immediately assure you that Grantham has not “lost his marbles”, “gone off the deep end”, or started suffering from delusions.
If you read the latest edition of his Quarterly Letter[8], you’ll find this Grantham quote:
“My personal fond hope and expectation is still for a market that runs deep into bubble territory (which starts… at 2250 on the S&P 500 on our data) before crashing as it always does!”
Grantham (of course) cannot predict how high into “bubble territory” the market can or will go … but he does make very clear that by sometime in the fourth quarter of 2016… the market run-up “will end badly”. How badly? [Do you really want to know?]
Grantham’s colleagues at GMO, Bill Inker and James Montier, offer a “tag team” narrative in this same Quarterly Letter that serves up images that might make even Stephen King jealous… a narrative that is titled:
YIKES! The GMO thesis holds that after the bullish bubble explodes, investment prospects will descend into underworld-like territory.
GMO‘s James Montier described the firm's base-case scenario for the next seven years as a “purgatory of low returns.”
Grantham has provided some more detail regarding this bleak outlook:
“On our data, with U.S. large cap equities offering negative returns (-1.5%) except for high quality stocks (+2.2%), with foreign developed and emerging equities overpriced (+3.7%), and with bonds and cash also very unattractive, investors have to twist and turn to find even a semi-respectable portfolio.
“It is a particularly tough process today with nowhere to hide and no very good investments compared to, say, the time around the 2000 bubble when there were several.”
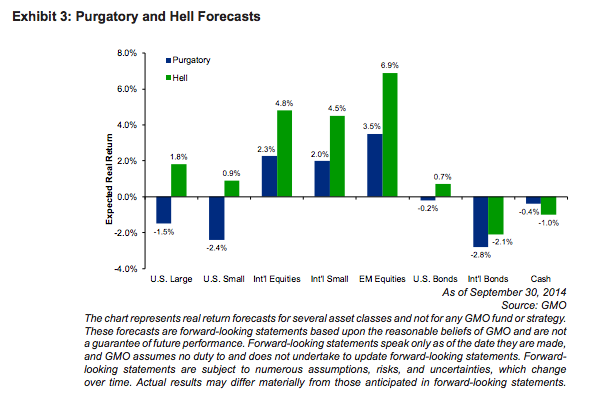
As his contribution to this dreaded forecast, Ben Inker serves up a scenario that is (only) a bit more positive for investors … but is worse for what one might call “savers”. The scenario he paints is the (so-called) “Hell” scenario.
GMO has presented an eye-catching graph of this vision of the future in that same Quarterly Letter. I must caution you that the graph won’t make clear and consistent sense until you read the fell text, since these GMO analysts created these scenarios (and the graph) from a very detailed matrix of financial analytics! :
Referencing this graph, here is what Mr. Inker has to say:
“Our official forecasts are for the Purgatory path and our hopes are there as well … because Hell is a very unpleasant long-run outcome for investors. [punctuation inserted by Petty for emphasis.]
“But if we knew we were in Hell, the right solution today is a decently risked-up portfolio. That portfolio doesn’t make sense in a Purgatory scenario, as the extra risk gives almost no additional return.” [As I have warned you, the entire text of the article is essential in understanding what they mean.[9]
INVESTOR TAKEAWAY:
OK, I am willing to admit that I am feeling quite frustrated and anxious about the “Market” as we approach the end of December. My portfolio performance during the first 12 days of December has definitely (more than) confirmed Grantham’s data with regard to relatively poor stock performance during the first half of December! I have backed out of a number of positions I was “counting on” to offer a positive return.[10]
So in these moments (over 24 hours before the start of Monday’s market “open”) I have grasped onto Grantham’s “Presidential Cycle Indicator” much as a shipwrecked passenger clings to a life raft in the midst of a turbulent sea!! I keep thinking that if I had made better decisions (like not booking passage on the Titanic) I would not be hanging on by a thread in a raging sea!
But thank heavens that Captain Jeremy Grantham, at the helm of his vaunted “Presidential Cycle”, has established an incredible performance record of “delivering” what investors like me need at times such as this!! As I bob up and down in the waters, I am praying that the “Cycle” will rescue me and carry me safely and securely (way) “above water”!!
Then (alas) I wake up and realize I have fallen into the always (and ever) way too alluring temptation of counting on experts and/or transcendent forces to save me… rather than taking full responsibility for my own trading decisions.
Ultimately what is needed is a well-defined plan… and the discipline to stick with that plan no matter what. If that plan incorporates Grantham’s “Presidential Cycle” … history would indicate that said plan would offer a high level of expectancy.
However, we must also remember and accept the fact that flexibility and risk management will always be essential I trading… because even the best experts and the most timeless historic patterns have been proven faulty at the most inopportune moments!!
DISCLOSURE:
The author doers not own any funds managed by Grantham or GMO. Nothing in this article is intended as a recommendation to buy or sell anything. Always consult with your financial advisor regarding changes in your portfolio – either subtractions or additions.
FOOTNOTES:
[1] And coarsest of terms, as well!
[3] And “No!”… I will not accept responsibility for the crumbling of oil prices!!
[4] From WebMD.com on this condition: “occurs when the immune system develops a specific allergen fighting antibody (called immunoglobulin E or IgE) that drives an inappropriate or exaggerated reaction toward a substance that is normally harmless. Your body may not react upon initial exposure but may produce antibodies with later exposures.” With regard to equities… the normally harmless “substance” was a lower oil price… but as the price continued downward, “harmless” started becoming perceived as dangerous. To expand the parallel, as an anaphylactic condition builds, a human body can suffer from symptoms such as swallowing and breathing difficulties, abdominal pain, cramps vomiting, diarrhea…” I know that during the week, as this “shock” grew stronger, I felt like doing many of those things.
[5] See my later observation from the “discover” of this Cycle!
[6] Promise me now… You are taking my questions seriously. I assure you that you’ll get a lot more out of the article that way!
[7] The criteria the journalists are told to apply to the award is: “the ability to move markets or shape ideas and policies”.
[8] In case you haven’t gathered this by now, Grantham’s Quarterly Letter is well worth a look when it comes out… example: http://www.gmo.com/websitecontent/GMO_QtlyLetter_3Q14_full.pdf
[9] I applaud Inker, Montier, and Grantham for couching this investment analysis in such graphic theological terms… a true rarity these days!!!
[10] Lesson for Petty… for the umpteenth time: “Never ever, ever ‘count on’ any return from any position you take. … That is one of the “deadly sins” in the trading world!
Related Posts
Also on Market Tamer…
Follow Us on Facebook


 Federal Taxes on Social Security Benefits Could Be Eliminated If Trump Has His Way. But There's a Dark Cloud With This Silver Lining.