Could a FLOATING RATE BOND fund or ETF be a good fit for you??Could a FLOATING RATE BOND fund or ETF be a good fit for you??
Whether you love Wall Street or hate Wall Street[1], there is no denying that it has always been very productive in the creation of new investment products with intriguing names … accompanied by what (at least usually) sounds like a compelling narrative explaining the appeal of each product.
This strength of Wall Street’s was evidenced in April of 2011 when Van Eck Global rolled out the Market Vectors Investment Grade Floating Rate ETF (FLTR), which promised to provide investors with a “floating” yield that would adjust upward whenever the U.S. Federal Reserve decided to start lifting the key “Fed Funds Rate” from historic lows.
The concept of “floating rate” was hardly a new one. The Eaton Vance Corp., which is one of the nation’s oldest financial management firms[2], inaugurated the “floating rate” space back in 1989 through its Eaton Vance Floating-Rate Advantage Fund (EAFAX). A number of funds and closed-end funds developed during the years that followed – all of which offered some variation on the floating rate concept. But quite frankly, during the period between 1989 and 2011, during which (on a secular basis) the bond market experienced a huge extended rally, there wasn’t a lot of demand for the strategy.
That environment began to change by 2011, when bond market experts began to “groupthink” that the U.S. Federal Reserve (having just started its second round of monetary easing (“Quantitative Easing II”) in November of 2010) would at some point need to begin scaling back on monetary intervention and start allowing the Fed Funds rate to rise. Little did they anticipate “Operation Twist” (September 2011), its extension (in June 2012), or “QE III” (announced in December of 2012).
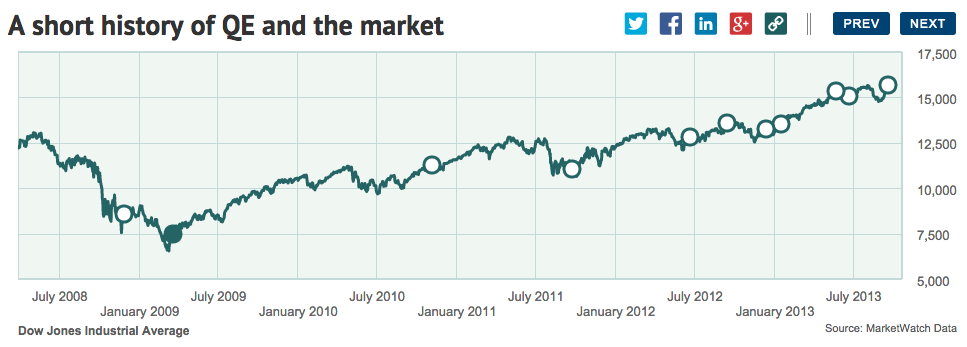
This a a TIMELINE of various stages of Federal Reserve "Quantitative Easing" relative to the U.S. Stock Market.
It may be difficult to remember back to April of 2011… but believe it or not, investors felt “starved” for yield back then!. After all, the 10-year U.S. Treasury Security was only yielding 3.2%!! Where were investors going to find a yield sufficient to provide for their income needs … particularly as rates began rising in the coming months (which many predicted was almost inevitably going to be “soon”).
We (of course) have the advantage of hindsight – and that makes it quite easy for us to marvel at how wrong the experts (and investors) were back in 2011. With the 10-year Treasuries currently yielding just 2.4% (after having fallen below 1.5% between 2011 and today), many of us actually salivate over a 3.2% Treasury yield![3] It has been a long time since we saw those levels.
I am sure that we all agree that Wall Street’s timing on the rolling out of “floating rate” products left something to be desired. But the rationale for the instrument was impeccable! The country (and the world) cannot tolerate monetary easing forever. At some point, rates will begin to rise!
So let’s briefly summarize the conceptual foundation of “Floating Rate” fixed income instruments:
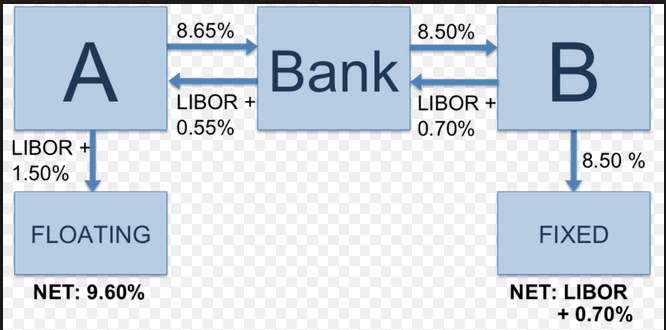
1) As you know, a traditional bond security has a “fixed coupon” (it promises payment of a certain amount on a regular calendar basis). In contrast, a “floating rate note” is a bond that pays interest based upon a stated formula that adjusts as rates adjust (it offers a “variable coupon”).
a) A current 10-year U.S. Treasury bond with a par value of $1,000 might pay out $24.10 per year (investor would receive semi-annual checks, each totaling $12.05).
b) A floating rate note operates in a different fashion.
i) The rate is usually based upon a reference rate (often that rate is the LIBOR rate) plus a certain fixed spread. As an example, if the reference rate is 3-month LIBOR[4] plus .5% paid out quarterly[5] … the rate at which interest would be paid each quarter is 0.28% (the current 90 day LIBOR) plus .5% or .78% — $7.80 on a $1,000 par value note.
ii) Note that there is usually a “Floor Rate” below which the note’s interest payouts will not fall.
iii) Each note stipulates how often the operative “payout rate” will be adjusted – generally 30 days, 60-days, or 90-days. (Obviously, the more frequently the rate is reset, the less interest rate risk an investor faces.
In an environment within which the chief daily financial media question still seems to: “When will the Fed start raising rates?”[6] … the “floating rate” concept appears to make a lot of sense, doesn’t it??
However, investors must be extremely aware that not all “floating rate” instruments are the same… nor are they equally “safe” or “risky”!!
At the risk of oversimplifying, I would segment the “floating rate” space into three broad categories:
1) U.S. Treasury Floating Rate
2) Investment Grade Corporate Bond Floating Rate
3) (Senior) Bank Loan Floating Rate
In the examples that follow, I do not in any way intend to recommend any individual fund or ETF to you as an investment for your portfolio. I have no idea what your financial situation is, nor what your tolerance for risk might be. Therefore, the examples I offer are strictly for purposes of education and comparison from one instrument to another. You will need to do research on your own to uncover whatever other data or investment choices might be best suited for your unique needs!
I) U.S. Treasury Floating Rate:
For purpose of illustration, here is data pertaining to two ETF’s which invest strictly in U.S. Floating Rate Treasury Bonds – a relatively new U.S. Treasury instrument (first issued January 2014) with interest payments that adjust based upon the discount rates from the government’s periodic auction of 13-week Treasury bills.
Two such ETFs are:
TFLO iShares Treasury Floating Rate Bond
USFR Wisdom Tree Bloomberg Floating Rate Treasury
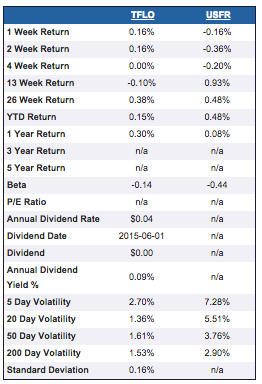
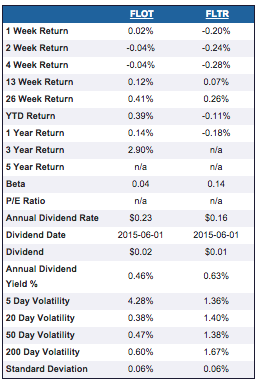
Key metrics (from the great http://etfdb.com/tool/etf-comparison tool) are as follows:
Take note that the YTD ad 26-week returns from the two ETFs are quite different than the 1-Year Return. Also note the differences in the 200-day volatility.
In either case, the return that can be expected is limited by the nature of the 13-week Treasury Bill rates off which they are based. But there is no risk of the underlying bonds (U.S. Treasuries) going bankrupt (unlike corporate bonds).
II) Investment Grade Corporate Bond Floating Rate
These ETFs manage portfolios composed of U.S. corporate debt that has been rated “investment grade” by at least one major rating agency. Although each bond in the portfolio has its own terms regarding the reference rate, adjustment period, etc. the portfolio is designed so that the interest payouts received by an investor will rise as short-term benchmark rates rise. Note the way I expressed that process – “short-term benchmark rates”. That is intentional because rate movement within the daily corporate bond trading market will not necessarily impact these bonds – nor will rate movements within 20-year or 30-year bond space impact payouts from these ETFs. They are intended to reflect movement in shorter-term benchmark rates only!
Three examples of such ETFs sponsored by major ETF providers include:
FLOT iShares Floating Rate Bond ETF
FLRN SPDR Barclays Capital Investment Grade Floating Rate ETF
FLTR Market Vectors Investment Grade Floating Rate Bond ETF
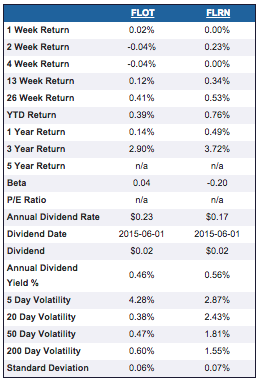
Each investor has different needs and a unique outlook on risk. If you pour over the data above, you may find the metrics helpful in discerning key qualities about these three ETFs. For simplicity’s sake, here is an image from the outstanding Morningstar site comparing FLOT with FLRN:
No matter which ETF you may prefer, it can be agreed upon that any of the three offer a significantly higher yield than the average retail money market fund does. In addition, it offers a higher yield than Treasury Bills or the U.S. Floating Rate Note ETF’s.
But we can also agree that none of the above offers a yield that one could even remotely describe as “tantalizing”. For that level of return, we must turn our attention to the third category of “floating rate” funds.
III) (Senior) Bank Loan Floating Rate
I have read through numerous definitions of Bank Loan Floating Rate instruments. I usually find that the best definitions come from a source that does not engage in selling investment instruments. However, in this instance, I found the definition offered by PowerShares to be the most helpful:
“Senior loans (also called leveraged loans, syndicated loans, bank loans or floating rate loans) are privately arranged debt instruments that provide capital to a company (usually with a below-investment-grade rating) and are issued by a bank or financial institution and syndicated by a group of banks and institutional investors.”
Features touted by the providers of these instruments as key “pluses” for the investment case behind such funds are these points:
1) (Of course) a flexible rate:
“The rate paid by a senior secured floating rate loan ‘floats’ at a pre-determined spread over a reference rate, usually the U.S. dollar London Interbank Offered Rate (LIBOR). For example, if three-month LIBOR were yielding 2.50%, a senior secured floating rate loan with a spread of 3.00% would yield LIBOR + 3.00% or 5.50%. The reference rate, in general, is then reset every 30, 60, or 90 days, so that the aggregate rate floats in lockstep with the reference rate.”
2) Priority within the capital structure of the company that stands behind the debt:
“Within a company's capital structure, senior loans are typically:
- Senior to the claims of other creditors.
- Protected by performance and leverage based covenants.
- Secured by collateral, such as property, inventory, equipment and intangibles.”
What this means (in simpler terms) is that if the company responsible for servicing the loan goes bankrupt, holders of bank loans should be paid off before holders of either bonds or stock.
In what way might an ETF that invests in Senior Bank Loans be of interest to the average investor? The basic, simple reason is the effective current yield!
Here is a table that summarizes the current yield offered from four “mainline” ETFs in this space (my printed list is in alpha order):
BKLN PowerShares Senior Loan Portfolio
FTSL First Trust Senior Loan Fund
SNLN Highland/iBoxx Senior Loan ETF
SRLN SPDR Blackstone GSO Senior Loan ETF
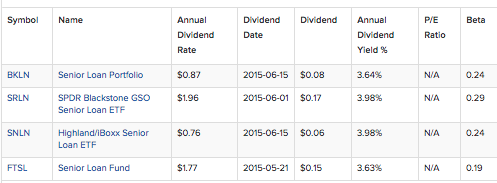
As you can see, yields currently range between (almost) 4% down to about 3.6%. Compared with the other floating rate choices, they may sound tantalizing to some of you.
However (you knew this was coming, I hope!) that yield is accompanied by risks that may not be apparent to you at first blush!
Let me try to outline as many of the risks inherent within these bank loan investments as I can:
1) If/when a recession comes, these investments will naturally be considered at much greater risk by the market. After all, interest payments from the debtor company will (as always) depend upon the profitability of said companies vis-à-vis their other obligations.
As a natural corollary, of course, as the economy becomes stronger, these investments will look increasingly attractive. Underlying company profits (in the aggregate) should be greater, increasing “coverage” on any debt. And as rates rise, these instruments will begin to pay out increasing interest payments.
2) Related to the first point, but still distinct, is the average credit rating of companies in this “Bank Loan” category. It stands to reason that companies with the financial capacity of an Apple (AAPL) or Microsoft (MSFT) or Berkshire Hathaway (BRK.A) do not need to secure these types of bank loans, since they are more than capable of issuing bonds at very attractive rates.
The type of companies that do secure these types of loans tend to be companies below the upper tiers in corporate credit ratings – with many falling below investment grade. The folks at PowerShares themselves disclose the following:
“Senior loans are typically issued in conjunction with leveraged buyouts, mergers or acquisitions.”
Therefore, even though bank loans hold a higher priority than do high-yield bonds or other credit, if a debtor company falls onto hard times, the interest and principal of any given loan is at risk.
3) Liquidity Risk: related to both 1) and 2)… but adding an additional dimension, are risks related to “liquidity”. Simply put, liquidity risk is a security’s relative ability to be sold with steep transaction costs or loss in value. If at any given time a significant imbalance develops between the number of holders who want to sell a particular investment and those who are willing to buy it, “liquidity risk” comes into play.
With regard to bank loans in particular, their very structure contributes to at least some level of higher liquidity risk. Traditional bonds trade electronically on the over-the-counter market. In contrast, many bank loans trade as private transactions. Therefore, although the ETF (or a fund) that holds such bank loans does trade on the open market electronically – the underlying financial instruments often do not. It is not uncommon for certain bank loans to need to be physically delivered between the buyer and seller. Therefore, settlement times for such loans can be (relatively) lengthy (up to 25 days).
In light of the above, what Sarah Bush of Morningstar has observed is well worth noting.
During 2008 (with its many liquidity events) bank-loan mutual funds sank 30 percent. Just as noteworthy is that their decline was even deeper than the dip within junk bond funds. On the surface, that makes no sense – remember that bank loans are collateralized and hold a higher standing within the corporate debt structure!! However, as investors rushed to the exits, bank-loan funds had to sell those loans into a bear market, which detracted significantly from their market value.
Of course, in our current market environment, these issues could become even more amplified than usual (see https://www.markettamer.com/blog/bonds-dying-of-thirst ). In fact, it was announced in June that TCW Group, a Los Angeles-based investment company managing almost $140 billion in U.S. bonds, has been accumulating an abnormally high level of cash in its portfolio – the highest such level since 2008! As explained by TCW’s chief bond manager (Jerry Cudzil): “We never realize what the tipping point is until after it happens. We're as defensive as we've been since pre-crisis.” I hasten to add that TCW is not alone in this acting with great caution. According to FTN Financial, bond funds (on average) are holding about 8% of assets in cash equivalents – the highest level since at least 1999.
4) The Market Price of these ETFs can, at times, exceed their Net Asset Value (when there is especially high demand) and, when the ETFs become flooded with new funds, the aggregate impact within the bank loan marketplace is a “bid up” in the price paid for those loans.[7]
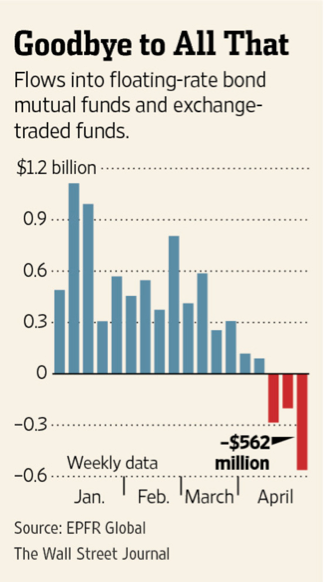
Reflecting the inevitable ebbs and flows of investor demand, there were three straight weeks in April of 2014 during which investors pulled about $1 billion out of bank loan funds and ETFs. Prior to that April, this investment space had not seen three consecutive weeks of net outflows for almost two years! Here is a Wall Street Journal graph from that month showing the huge outflows… with over half of the funds exiting during that third and final week.
Here is a scary thought… combine that level of investor desire to “get out” of bank loans with a huge “market event” and what bond experts such as Jeffrey Gundlach and Bill Gross have been calling a “liquidity” shortage – just imagine what level of price volatility we might witness!
5) Lest you think that, by now, I have surely listed all the risky characteristics of fund or ETF investments in senior bank loans, I haven’t. As recently as March of 2014, Cara Esser of Morningstar (a senior fund analyst) pointed out that although closed-end funds invested in floating rate bank loans don’t wrestle with the unpredictable flows of funds into and out of their portfolios… and although some such closed-end funds can be purchased at a market price significantly less than its NAV… 23 of the (then existing) 24 closed-end bank loan funds employ leverage to pump up their return. That is just one more significant risk an investor faces if she/he buys a closed-end fund within that space!
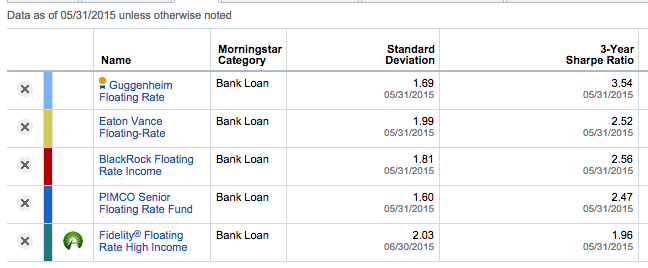
Finally, for those who may still want to consider a position within this space, here is a far from exhaustive list of popular mutual funds invested in floating rate securities. The list of funds I could compare with was limited by the extremely helpful tool provided within Fidelity Investments’ website for comparing funds:
I encourage you to review and analyze all of the metrics shown here.
In my opinion, the key metrics upon which to focus include:
1) Load or No Load (prefer No Load)
2) Average Duration (a measure of exposure to interest rate risk).
3) Three-Year Performance (to see how management has done over more than the short haul)
4) Expense Ratio
5) Yield
6) Standard Deviation (measure of volatility)
Please note that recently, this space has come under some pressure with regard to “return”. As you can see, all of them report a1-Year Performance that is less than its corresponding 30-day Yield! (meaning that the market price has decreased during the period).
None of these funds are superior in all categories – you’ll have to prioritize what is important to you! But note that the Fidelity Floating Rate High Income (FFHRX) is a “No-Load” fund with the highest Assets Under Management (AUM) and lowest expense ratio, as well as lowest Average Duration. That hardly makes it the “best choice”… or even a “good choice”, for that matter. Such evaluative judgments are for you to make!
INVESTOR TAKEAWAY:
I hope you were struck as much as I was by the contrast between the market environment in 2011 (when we all thought we were getting short changed on “interest earned”) and today!! Wow! Humans have a great capacity to “forget” much of the past. How I would love to earn 3.2% on a 10–Year U.S. Treasury Bond… or to have known that oil would tank to below $50/barrel!!
I have a confession to make:
The “case” for “Floating Rate” securities made so much sense to me back in 2011 that I positioned a good deal of my portfolio in them. I kept thinking that the “insanity” of Quantitative Easing could not possibly last much longer and interest rates must “surely” be headed upward!
Boy was I wrong!! Do you ever feel like a total “idiot” for being “taken in” by “groupthink” and then realizing you were a fool?
You couldn’t possibly have been any more wrong than I was!!! I believe I have more than earned the “merit badge” for such categories as:
1) “Taken In” by a seemingly compelling story spun by Wall Street.
2) “Underestimation of Government’s Willingness to Mortgage the Future” – do some detailed research on the history of massive monetary easing… and then contemplate how on Earth the Fed, the ECB, the Japanese Central Bank, and countless others are going to unwind “QE” without really undesirable effects!
3) “Sacrificing Equity Return for Hoped For Lower Risk”. Since I must keep my articles rated “G” for family reading, all I can say is: “If I had only….[8] Invested the money I put in Bank Loan finds into U.S. Equities instead… I’d be up tens of thousands of dollars!”
It may be little comfort to me, and of absolutely no help to you, to offer up this fact:
I could have done better in equities… but I did not do badly in bank loan instruments until about one year ago. At that point I should have been willing to trim back on loan funds and at least invest more within a “Balanced Fund”
But we can all agree that hindsight is better than foresight!!
I will say that on days like Monday, June 29th, I lost a lot less in bank loan funds than I did within the S&P 500 Index, the NASDAQ 100 Index, or the Russell 1000 Index!!
DISCLOSURE:
The author currently owns Fidelity Floating Rate High Income (FFHRX), PowerShares Senior Loan Portfolio (BKLN), Highland/iBoxx Senior Loan ETF (SNLN). Nothing in this article is intended as a recommendation to buy or sell anything. Always consult with your financial advisor regarding changes in your portfolio – either subtractions or additions.
FOOTNOTES:
[1] If “loving Wall Street” was likened to being a strong right handed batter… and “distrusting Wall Street” likened to being a solid left handed batter… I could be considered a switch-hitter, but much more effective from the left side than the right.
[2] Eaton Vance itself was founded in 1979… but is the result of a merger between Eaton & Howard, Inc., which had been managing investments since 1924, and Vance, Sanders & Company, which was organized in 1934.
[3] It may prove helpful to you to be reminded that back in the Spring of 2011 – Oil was priced at $110/barrel ($57/barrel today) and Gold stood at over $1,500/oz. (under $1,200 today).
[4] LIBOR stands for “London Interbank Offered Rate”. It's the rate of interest at which banks offer to lend money to one another in the wholesale money markets in London.
[5] It is significant that most floating rate notes pay out quarterly rather than semi-annually)
[6] I should add… that is the chief question when CNBC guests aren’t being asked “Will Greece default and leave the Eurozone?”
[7] There are occasions when funds or ETFs have paid a “premium” to par value for select bank loan offerings.
[8] Those must be the most overused four words in the investment world!!!!!
Related Posts
Also on Market Tamer…
Follow Us on Facebook




 Why JetBlue Stock Was Tanking This Week
