AAPL is perhaps the company receiving the most attention right now. Apple’s earnings are due on October 25th, after the market close. On Tuesday, Marketwatch.com and other sites had multiple articles on why you should get out of Apple now. They described a Head and Shoulder top, a recent price-undercutting pattern, MACD divergences, and a blow-off top. It’s like a ‘banana split’ of analysis – no matter what your favorite is, it’s on there.
All very convincing articles. Apple is so heavily held by institutions that if they are coming to similar conclusions, the selling could quickly avalanche.
Apple is still a formidable company. The iPhone5 is getting all the attention. But I’ve been noticing something else – the iPad. I’m starting to see iPads everywhere. I know several people who have bought one of these 400-700 dollar ‘toys’ recently, and none of them are traditional tech-toy buyers. I say toy because a cell phone can be justified as a need. An iPad is basically an overgrown iPhone without the cell service (higher-end models have even that). It isn’t bought so much for a basic need as a toy to play with. The bartender at my favorite Thai restaurant surfs on hers when business is slow. An exterminator I know bought one just to keep and share pictures with his new granddaughter. A traveling salesman I know bought one for his wife so she can keep in touch with their grandchildren and to help file his travel records.
The list goes on and on. The iPad is becoming as much a part of everyday life as the iPhone has become, but it isn’t getting much attention. The iPad-mini Apple will be coming out with soon may make this product’s sales explode. I’m starting to wonder if in a couple of weeks Apple won’t surprise on the upside. I’m certainly going to be watching AAPL in late January when it will report Q4 earnings.
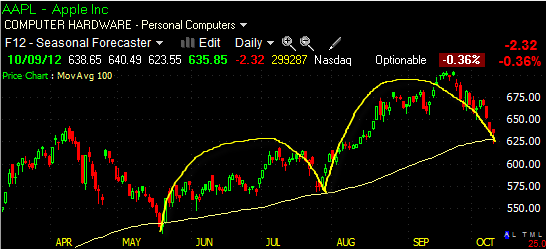
Looking at AAPL’s chart, and using a 100-day EMA (Exponential Moving Average) instead of the more common 50-day MA, I see AAPL touched the MA back in May, moved upwards over two and a half months, then fell back to touch the MA again in July. AAPL then had a strong rise into September, but has recently pulled back again. The recent pullback had some high volume days, which along with the doubt being expressed in financial articles makes one wonder if a sharp drop for AAPL is just beginning.
But today, AAPL fell back enough to touch the 100-EMA it has bounced off in the past. Then it closed the day near its high. Japanese candlestick pattern fans call this a ‘hammer’. The stock opened at the high for the day, dropped to the low for the day, then rose to close near the open, forming a ‘hammer’ (or lollipop) pattern.
Buying came in towards the end of the day when traders determined AAPL’s current price represented good value. If this proves to be a pivot-low, a second 2-1/2 month cycle will have formed. I like repeating cycle patterns – they don’t last forever, but if you identify one, you can often ride it for another cycle or two.
In Monday’s newsletter I covered how straddle trades work on AAPL’s earnings announcements. Entering a directional trade on AAPL right now is risky. This normally would be a good spot to consider a November at-the-money straddle – there is potential for a good move in either direction. The problem though is volatility.
The Implied Volatility of AAPL’s options have jumped in the past few days – they are now in the upper third of the past year’s range. Straddles, a good trade to bet on a likely increase in volatility and movement in either direction, are overpriced right now. A November ATM straddle costs about $6,000 right now, and the breakevens on the trade would be at 575 and 695, making a profit very unlikely. While pullbacks to major MA’s are often good times to buy the stock of great companies, you would be risking a lot for any type of trade in AAPL right now. Even an income trade like a bull put credit spread could quickly get into trouble and adjustment options might be few. Sit this one out.
Of course, there's much more you need to know and many more stocks you can capitalize upon each and every day. To find out more, click here www.markettamer.com/newsletters
By Gregg Harris, MarketTamer Chief Technical Strategist
Copyright (C) 2013 Stock & Options Training LLC
Unless indicated otherwise, at the time of this writing, the author has no positions in any of the above-mentioned securities.
Gregg Harris is the Chief Technical Strategist at MarketTamer.com with extensive experience in the financial sector.
Gregg started out as an Engineer and brings a rigorous thinking to his financial research. Gregg's passion for finance resulted in the creation of a real-time quote system and his work has been featured nationally in publications, such as the Investment Guide magazine.
As an avid researcher, Gregg concentrates on leveraging what institutional and big money players are doing to move the market and create seasonal trend patterns. Using custom research tools, Gregg identifies stocks that are optimal for stock and options traders to exploit these trends and find the tailwinds that can propel stocks to levels that are hidden to the average trader.
Related Posts
Also on Market Tamer…
Follow Us on Facebook


 Why Bitcoin, Ethereum, and Dogecoin Are Surging Higher Today