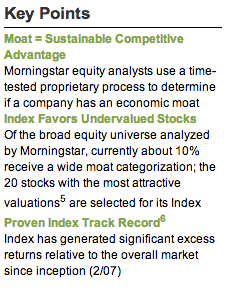
A generally underutilized resource available through the Internet (without cost) is the website for Market Vectors Wide Moat ETF (MOAT) (https://www.vaneck.com/funds/MOAT.aspx). As a brief reminder regarding the nature of MOAT, it is a relatively concentrated portfolio of approximately twenty (currently 21) financially strong companies with above average future prospects and a sustainable competitive advantage (ie. “Wide Moat”). The portfolio is rebalanced quarterly (at an equal weighting per stock) with stocks that have moved beyond “fair value” being replaced (one-for-one) by stocks from their regularly updated list of top, undervalued “Wide Moat” companies. [For details regarding the selection process, see the “Key Points” Slide in the Appendix… as well as these past articles in this space regarding MOAT: [https://www.markettamer.com/blog/how-to-find-stocks-with-economic-moats ; https://www.markettamer.com/blog/why-was-facebook-kicked-out-of-moat].
Before I move on to the prime content of this piece, let me highlight three characteristics that make MOAT an outstanding, free, and underutilized resource:
1) Obviously, MOAT metrics are tilted toward solid prospects for future earnings growth… growth that is sustainable (“Wide Moat”) over an extended period of years. However, the purchase of stocks that meet these criteria is filtered through a “relative value” screen – thereby adhering to the essence of the value investing mantra of Warren Buffett (and his mentor, Benjamin Graham).[1]
Modifying the oft-used acronym “GARP” (Growth At a Reasonable Price) as it applies to MOAT… we could say that this ETF uses the “safety net” of “MARP” (Moat At a Reasonable Price);
2) Any investor desiring a list of excellent companies available at a reasonable price who prefers to avoid subscribing to an expensive service can access the MOAT website and review the 20 companies that comprise its current portfolio, as well as the next 20 highest rated “MOAT” stocks;
3) One note of caution: Although the “Investment Strategy” behind MOAT is parallel with the philosophy (and history) of Warren Buffet, the average “holding period” for a stock in Buffett’s portfolio is much, much longer than the holding period of stocks in MOAT. [Its quarterly rebalancing schedule means that MOAT regularly reports a relatively high “turnover rate”… but that makes the ETF's website even more valuable because “fair value” is regularly updated.]
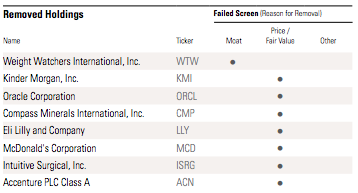
The most recent MOAT “re-balancing” took place on March 21st. Here is a list of the issues that were removed from the portfolio on that date:
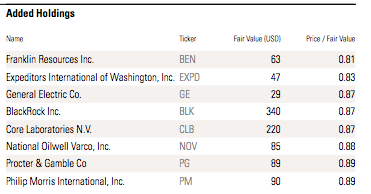
The stocks that were newly incorporated into the MOAT portfolio were as follows:
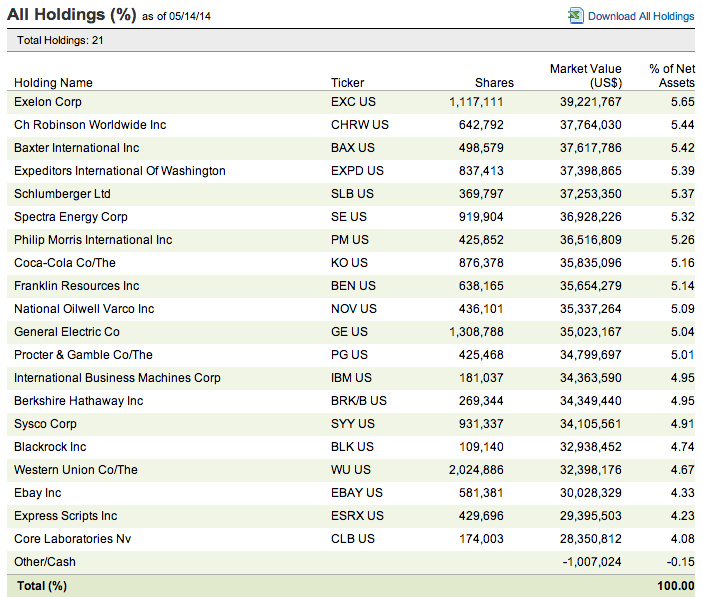
Here is the MOAT portfolio as it has been constituted since that 3-21-14 rebalance date:
Adding to an investor’s list of potential “MARP” buys is this list from MOAT:
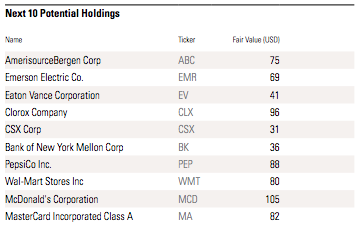
Here are the top top "backup" stocks available in the future for inclusion within the MOAT portfolio.
Meanwhile, the performance data from the first month following that March rebalance event is in. During the month of April, the total return from the S&P 500 Index came in at 0.74%, while the total return from MOAT for that period totaled 1.19% (or almost 61% higher than the S&P).
MOAT’s top performer during April was CH Robinson Worldwide, Inc. (CHRW). CHRW was “talked up” by several analysts within its “Freight and Logistics” space – driving its total return during April to a splendid 12.43%. The MOAT stock that turned in the second best April performance was Spectra Energy (SE) – providing a 7.5% total return.
On the opposite side of the performance scale, April’s biggest detractor was Express Scripts (ESRX) – which got dragged down by 11.33% because (supposedly) first quarter profits proved to be a big disappointment to Wall Street. But demonstrating the “fickle finger of Wall Street”, eBay, Inc. (EBAY) reported strong first quarter results, but was knocked down by 6.17% during April anyway.
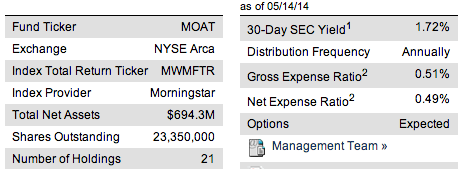
Now that you are familiar with MOAT‘s portfolio strategy, its rebalance schedule, and the current composition of the ETF, let’s take a look at its “Profile”. Note in particular that it has Assets Under Management (AUM) of approximately $700 million, and a “float” of almost 23.5 million shares. It does not currently offer options, but it is expected that there will be options in the future. The current annual yield is 1.72%; and its Net Expense Ratio is a reasonable 0.49%.
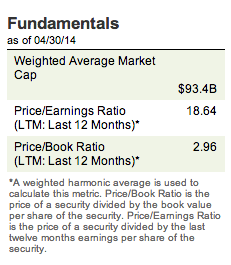
With regard to the “Fundamentals” of the portfolio (in the aggregate), you can view them below. (The ETF includes predominantly “Large Cap” stocks.)
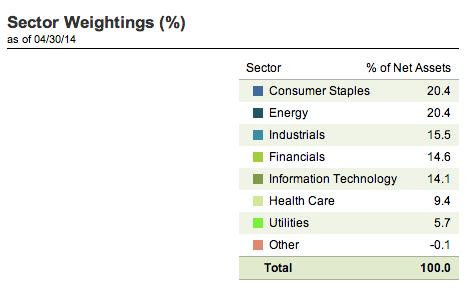
The two largest sector weightings (currently) are “Consumer Staples” and “Energy”. The next three largest (all of comparable weight) are: “Industrials”, “Financials”, and “IT”.
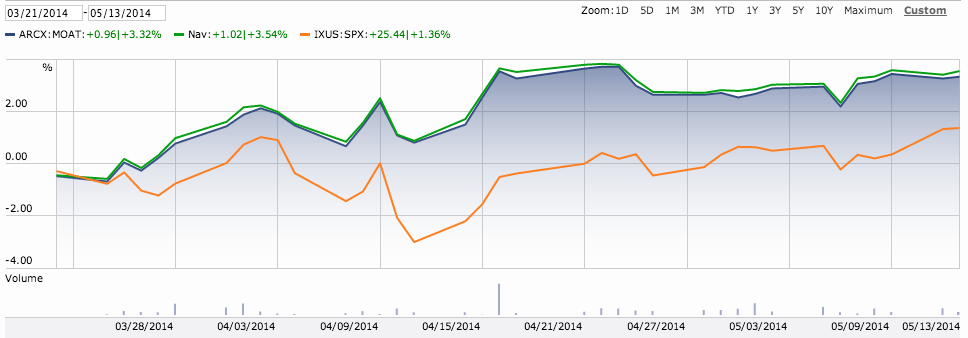
It is well worth noting that, from March 21st through May 13th, MOAT appreciated over 2% while the S&P 500 Index was essentially flat.
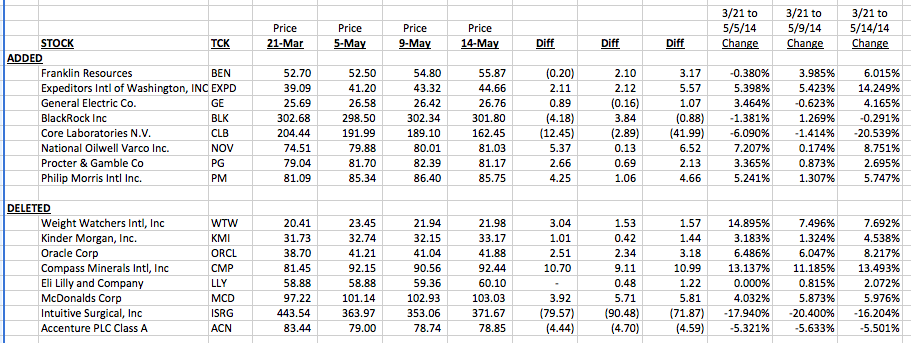
What follows may be the most enlightening part of this article. I put together a spreadsheet that includes a list of stocks added on March 21st, as well as those that were replaced on that date. I then researched the price of each issue on these dates: March 21, May 5, May 9, and May 14.
I included these dates because they reflect some of the most significant short-term volatility within the market. Take note especially of Core Labs (CLB) and Expeditors International of Washington, Inc. (EXPD) – each of which experienced significant double-digit moves during that period! [This is another great illustration of the absolute need for diversification!] I can assure you that the selection committee for the MOAT ETF does not intentionally pick a couple of volatile stocks for inclusion each time it rebalances the portfolio! However, we can see that three of the stocks that were removed from the portfolio on March 21st were also double-digit movers during this period!
Dissecting this portfolio and the performance of its individual components makes me very glad that I do not own CLB or ISRG as a “stand alone” holding within a personal account. I am not sure my blood pressure medicine would be able to work well enough to keep my medical metrics “within range”! That said, I do need to tip my hat to the professionals that manage MOAT – regularly offering us affordable access to a list of companies that have passed rigorous screens intended to identify financially strong firms that offer the prospect of above average profits over the next 10-20 years on a sustainable basis – and are currently priced at a very reasonable price!
INVESTOR TAKEAWAYS:
In my opinion, MOAT is one of the most well-designed, effectively managed, and easily understood investment vehicles available to the average investor today. In addition, the transparency of this ETF offers every investor willing to “click” into its website (https://www.vaneck.com/funds/MOAT.aspx)[2] a plethora of stock research. In effect, this MOAT site can be used by anyone interested in finding promising, financially strong companies (with a sustainable competitive advantage) that are either “fairly-valued” or “under-valued”. By clicking into the MOAT site, one will regularly find at least 30 such stocks.
If one then wanted to go one step further, a technical analysis “overlay” could be added in the trading of these professionally screened names – whether that be using the 8- and 21-day exponential moving averages for shorter-term trading or the 21- and 50-day (or 50- and 200-day) simple moving averages for longer-term trading. A much simpler method could be to use the MOAT screen in conjunction with Market Tamer services (the two “Algo” Strategies, the “Seasonal Forecaster” newsletter, the Live Trading Room, etc.) by (if you choose) trading with slightly larger “size” when one of these services identify a MOAT stock as a promising “Buy”.
Here is one final thought for your consideration. All astute investors know that there is only one “universal, absolute truth” within the investing world: “Stock prices will move up and down!” Anyone who claims to have some form of omniscience about the price direction of one or more stocks is either privy to “insider knowledge” or is lying. As Warren Buffett has written: “A prediction about the direction of the stock market tells you nothing about where stocks are headed, but a whole lot about the person doing the predicting.”[3]
Given the absence of true “absolutes” in investing, it should not be surprising that some analysts quibble about the Morningstar financial model that is used to screen stocks for inclusion within the MOAT portfolio. Those analysts suggest that tweaks here and there, or the replacement of a few metrics by alternative metrics, would improve that screening. However, in my opinion, such critiques are a matter of opinion rather than objective certainty. Given that, I choose to place my confidence in Morningstar, which has earned a solid reputation as a reliable source for financial analysis. Amplifying that point is the fact that MOAT has already demonstrated its ability to outperform the S&P 500 Index over time!
DISCLOSURE: Although I have traded MOAT, I do not currently own it. Nothing in this article is intended as a recommendation to buy or sell anything. Always consult with your financial advisor regarding changes in your portfolio– either subtractions or additions.
APPENDIX:
FOOTNOTES
[1] Financial scholars/analysts have published considerable research in recent years that demonstrates the following: stocks that score high on metrics that are considered a reasonable proxy for “moats” or “quality” have consistently outperformed stocks that do not measure as well on said metrics. This has been true in the U.S. since at least the 1950s… and true in developed foreign markets since the 1980s.
[2] http://etfs.morningstar.com/quote?t=moat is also interesting
[3] An additional truth about stock market movements is suggested by that timeless, worldly sage, Regis Philbin: “I'm involved in the stock market, which is fun and, sometimes, very painful.”
Related Posts
Also on Market Tamer…
Follow Us on Facebook

 Why Bitcoin, Ethereum, and Dogecoin Are Surging Higher Today


