I invite you to engage in my test (below) of your personal risk profile, as well as your money management skills (and perhaps your common sense).
You are an avid fan of Las Vegas, and your boss (in recognition of an outstanding year turned in by you through exceptional work — including overtime and personal sacrifice) has given you a 3.5 week stay at your favorite casino. The only expenses you must cover are those tied to shopping, entertainment, and gambling.[1] You decide to commit yourself to eight hours of gambling each day, and you promise yourself to only draw upon an initial $10,000 stake from your savings account. During your “non gambling” hours, you plan on going to shows, walking the Strip, and visiting with nearby friends.
After a bad first hour on “Day One” (you lost $1,143), you rallied during the second hour with a huge 3% gain. Your fifth hour garnered you a pickup of almost 2%, and you ended the day with a net gain of $487. You decide that $487 was a great start!
On “Day Two” you have some bad luck during the first two hours, but you rallied with a great third hour (over 2.6% gain) and seventh hour (up almost 3.3%). You ended the day up an additional $380!
By the end of your first week, your $10,000 stake has grown to nearly $14,825. Wow! You are up by almost 50% in just a week!
So here are your first “risk/money management” questions:
1) Do you stop gambling and decide to just enjoy the places and people of Vegas for the next two weeks – on the premise that you should be happy with a $4,825 gain?
2) Do you wire the $4,825 into your bank savings account so you can’t lose it… but keep on gambling with your initial $10,000 (you’ve got a “hot hand” and it’s too much fun)? [See Investor Takeaway for a suggestion]
3) Do you just keep moving ahead with your much bigger stake – filled with visions of even greater gains to come?
During Week Two you suffer some pretty harrowing hours of loss (one 6% loss and a 5% loss) – but you keep disciplined and steady and manage enough small winning streaks, plus a 6% gain and 4.5% gain, to wind up the week with your stake now up to $17,554![2]
Now I ask you to re-answer questions 1) through 3) above … based on your new (stupendous) winning total through two full weeks.
Week Three becomes a fascinating (and harrowing) week of gains and losses.
Through “Day Five” of this third week, you find your stake has grown to $21,003! Then on “Day Six”, you actually find that your stake has grown to nearly $22,000 (21,921).
Then your “luck” turns very bad – you suffer hourly losses of (rounded) 3.5%, 2.8%, 2.9%, 5.6% … with a few small gains interspersed here and there… but wrapping up with losses of 5.1% and 10.1%. Your stake has now shrunk to just $17,085!!
At this point (obviously) you can look at your circumstance as either “glass half full” or “glass half empty”. You are still “up” by over 70% relative to where you started on “Day One” – but you have also suffered a loss from your “high water mark” of 22.8% (21,921 vs. 17,085).
Whether you consider your “glass” half-full or half-empty says quite a bit about your personal risk profile! And how you decided to handle your winnings week-by-week[3] speaks volumes about both your risk profile and your preferred money management style!
Did you decide to set your (considerable) winnings aside each week and stick with using your core principal of $10,000 as your gambling stake … or did you choose to let your winnings “ride” on your incredible “lucky streak”? That is a question that is quite personal, as well as a question for which the answer reveals a very essential element of a person’s financial risk profile and money management skills!
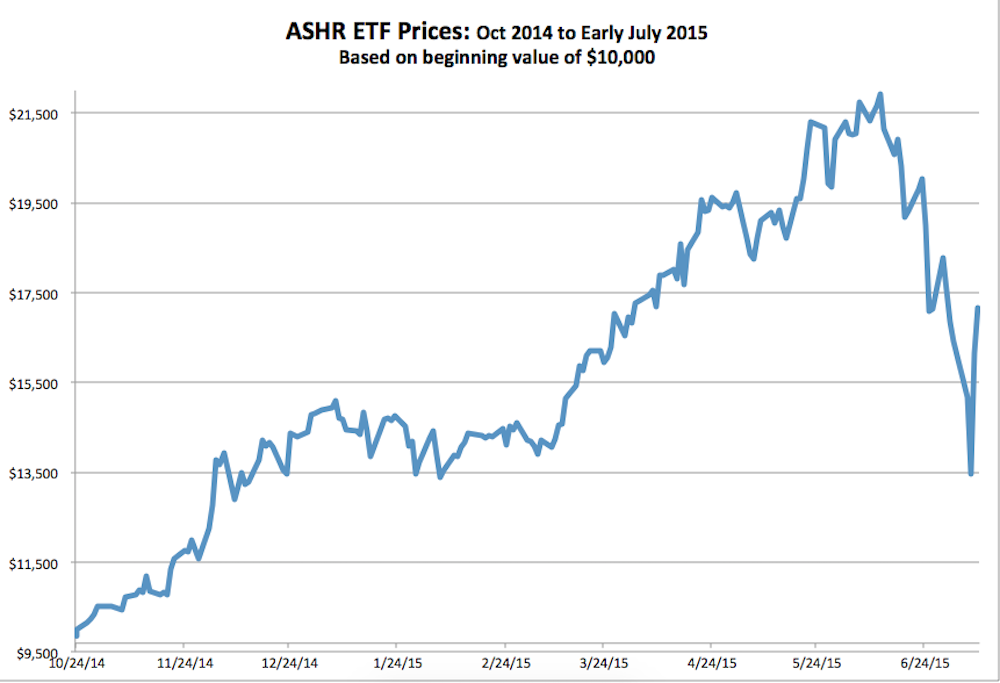
However, I am confident that you have already guessed what the above “test” was actually based upon. This is not really a “case study” of Las Vegas gambling. Instead, the basis for these theoretical Las Vegas “winnings” has actually been the daily closing market prices of the big “China A Shares” ETF called the Deutsche X-trackers Harvest CSI 300 China A-Shares ETF (ASHR)[4]. In creating my database, I downloaded the price data (from YahooFinance.com) available from October 24, 2014[5] through July 10, 2015.
I then “translated” the closing price difference from day-to-day during that entire period into virtual “hourly” gains/losses at a Las Vegas casino. As you have seen, playing China A Shares between October and June 12th (the most recent high) was quite rewarding (a nearly 112% return in less than 8 months).
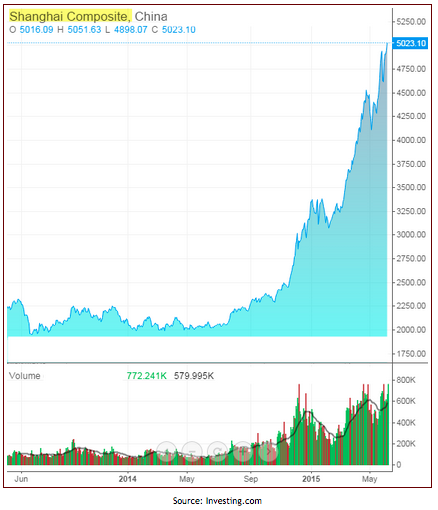
The sharp upward swing in Shanghai Exchange stock prices is a classic illustration of a "Parabolic Move".
It is enlightening to review how/why the Chinese Stock Market(s) got “out of control”.
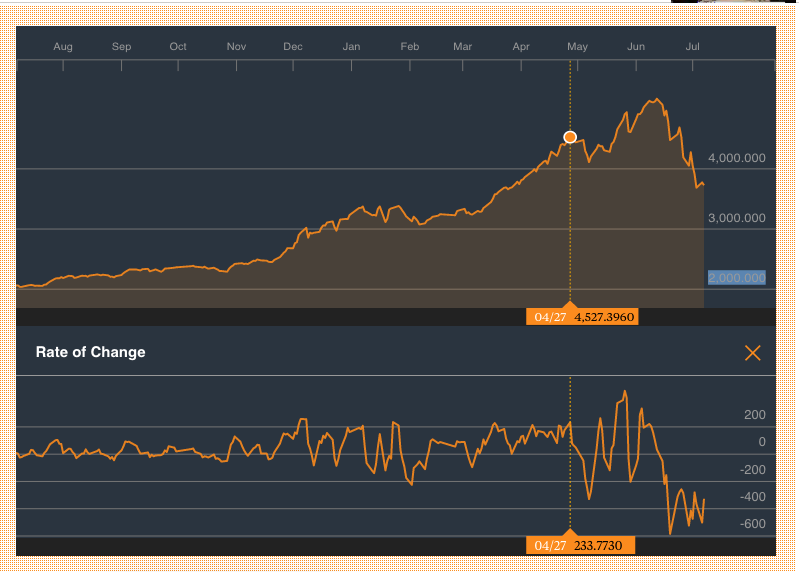
On April 27 of this year, the Shanghai market reached a (then) new high at 4527 and the "Rate of Change" had remained within a defined band
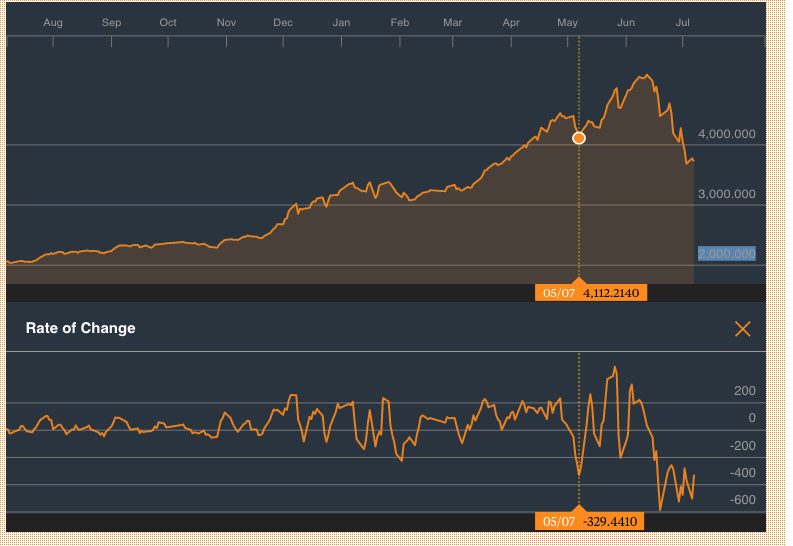
By May 7th, the market had tumbled down to 4,112... and the "Rate of Change" had moved outside of its defined band. Volatility was picking up.
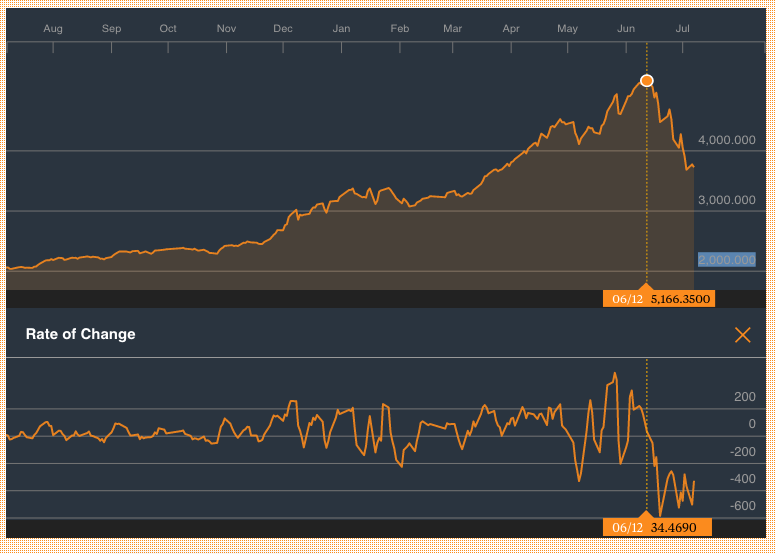
June 12th witnessed a new high, but as you can see, the "Rate of Change" had accelerated on both the upper and lower levels of the graph.
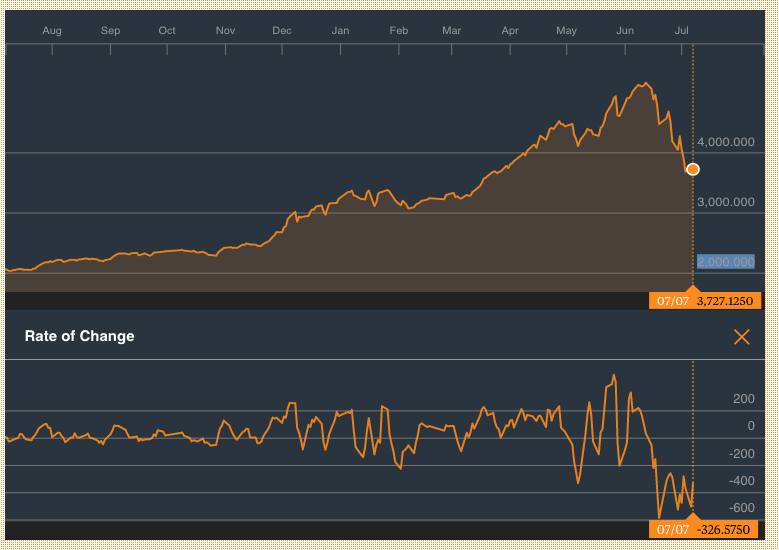
By July 7th, Chinese stock prices reached new lows and action by the government and by financial parties was fast and furious. By then, about one quarter of the listed companies has requested a cessation in the trading of their shares.
Most of our readers will not remember U.S. elementary and primary education curricula from the late 1950’s and early 1960’s. However, in those halcyon days[6] gone by, we viewed filmstrips, read texts, and heard stories from the People’s Republic of China (PRC) and the U.S.S.R. that chronicled the consistent failure of economic “Central Planning” by government leaders.[7]
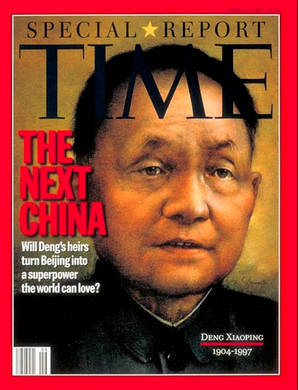
A key date in Chinese history is December of 1978, when the (then) Chair of the Central Advisory Commission of the Communist Party, Deng Xiaoping[8],
inaugurated 改革开放 (Economic Reform) … an “opening up” that was called “Socialism with Chinese characteristics”. That signal policy announcement marked the start of an inexorable rise by China within the ranks of global economies – and by the 21st Century, China (with the world’s largest consumer base) was widely viewed as the globe’s “growth engine” – averaging (then) annual growth of 10% per year.
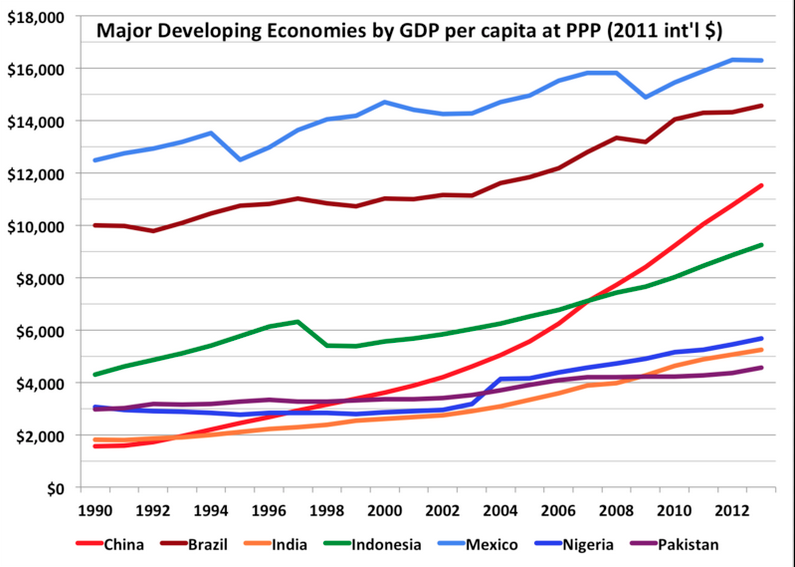
Adjusted for Purchasing Power Parity... this graphs shows how essential China was to global growth between 1990 and 2012.
Recognizing the importance of international and domestic investment, and the central role of active exchanges within that investment process, Chinese leaders began to (very) slowly open up their markets to ownership by investors from other nations.
“H-Shares” have been “available” to foreign investors for quite some time. As you might suppose “H-Shares” represent common stock of Chinese companies that are listed on the Hong Kong Exchange.[9] Ironically, although foreigners could own “H-Shares” prior to 2007, investors from “mainland” China were forbidden (by law) from, owning them. That changed in 2007 when the leaders of the PRC opened “H-Shares” to ownership by mainland investors — thereby giving a huge boost to demand.
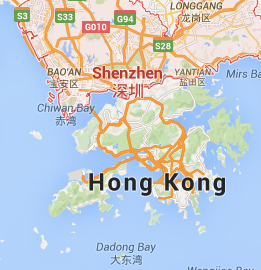
The other key ingredient within the existing Chinese equity market is commonly referred to as “A-Shares” – namely, common stock shares of China-based firms that trade on the Shanghai Stock Exchange and/or the Shenzhen Stock Exchange[10].
These shares have been the tightly controlled ones – forbidden to foreign investors except through a slowly evolving easing of restrictions. The main tool for the easing of said restrictions has been the Qualified Foreign Institutional Investor (QFII) system – which now (finally) permits a number of funds and ETFs to own A-Shares on behalf of foreign investors.
In this review of the Chinese equity market, it is of great significance to note that volatility within A-Shares has been greater than volatility within the more general Chinese market.
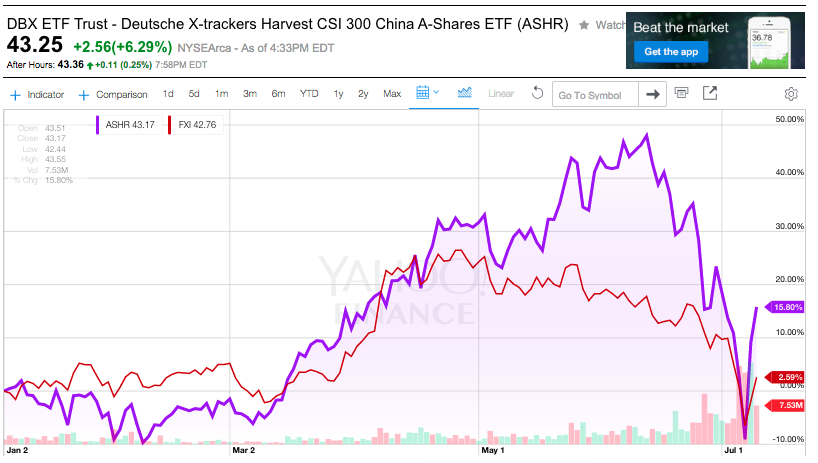
In the above graph of price movement between 1/1/15 and 7/10/15, the red line represents the biggest China-related ETF, iShares China Large-Cap ETF (FXI) (started long before A-Shares became available to U.S. ETFs or funds)…. while the purple line (and shaded area) represents Deutsche X-trackers Harvest CSI 300 China A-Shares ETF (ASHR) – the first of the ETFs permitted to venture into A-shares.
As you can see, the amplitude of FXI is much lower than that of ASHR. Just to ensure that you catch the magnitude of that difference – from January through June 12, ASHR zoomed up almost 50%, while FXI was up by approximately 27% — impressive, but much more modest than the gain in ASHR. Needless to say, volatility in ASHR has been much greater.
As we have witnessed within the financial news since the Chinese market high on June 12th – there have been a growing number of media stories with headlines that have included words that I would characterize as increasingly alarmist – from “fall” and “stumble” to “swoon” and “crash” – with increasingly dour visions regarding the fuller implications of this steep downward slope in Chinese stock prices. There were even stories within which the ultra-dreaded noun “Lehman” (from the 2008[11] U.S. bankruptcy that is forever tied to the world’s Financial Crisis) was included somewhere within the headline and/or subtext.
What most of these articles neglected to mention[12] is that the bull market in Chinese stock exchanges, as well as the amazingly widespread participation of “average investors” within those markets – was identifiably a consequence of concerted governmental strategic policy!
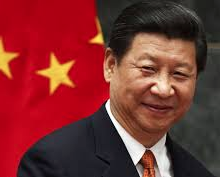
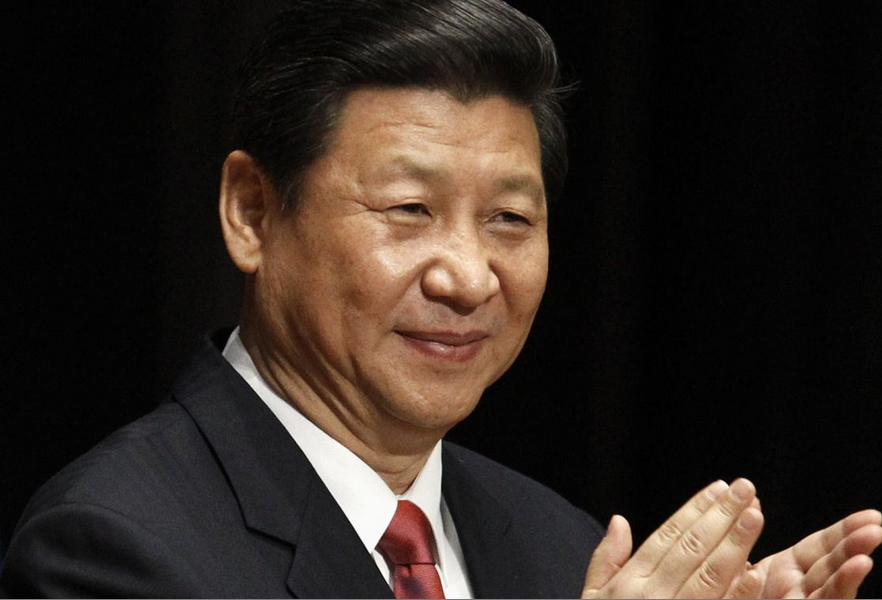
Let’s go back to November 2013, when the 18th Chinese Communist Party Congress held its Third Plenum in Beijing.[13] At that meeting, President Xi Jinping
offered the following statement: “We must deepen economic system reform by centering on the decisive role of the market in allocating resources….”[14]
Unfortunately, allowing consumer demand and “market forces” to dictate the allocation of Chinese resources has not been (in practice) a standard Chinese government policy. During the past 35 years, China has engaged in an extraordinary process of urbanization – directed in outline form from Beijing (politicians have designated regional areas and created regulations to direct development) but funded by local governments hamstrung by a fundamental financial handicap. According to World Bank reports, cities have been required to cover 80% of all the expense related to their area and population – but those cities have only been allowed to retain 40% of the area’s tax revenue. Therefore they have been forced to make up the difference through enterprise (largely land sales) and loans. Developers purchasing land from a city are required to develop said land within a relatively short period of time. The result has been predictable:[15]
1) An unprecedented era of urban development has taken place since the 1990’s[16];
2) This urbanization has not just occurred in areas currently populated… but also in vast reaches of formerly remote rural regions of central and western China (including at least one desert region).
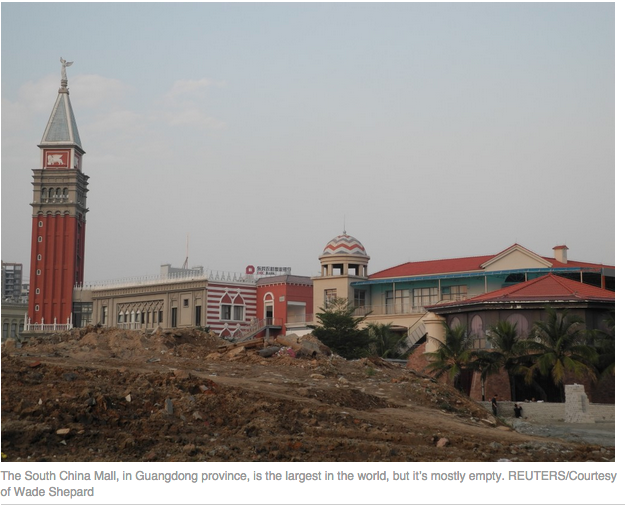
3) Without a vibrant economy to sustain an urban populace fit for any given newly developed “city” – the buildings within said city have become infamous because so many of them remain empty and lifeless.
a) Readers will commonly find references on the Internet to “Ghost Cities”
b) However, Reuters prefers this description of such cities: “they have not yet come alive!!”
4) Despite local municipality land sales that raised almost $440 billion in 2012, many local governments have felt squeezed enough to assume more debt than is healthy.
5) I encourage you to delve into more detail about the People's Republic of China and its economy and markets by accessing two prior articles:
https://www.markettamer.com/blog/what-is-the-chinese-conundrum-of-china
https://www.markettamer.com/blog/the-chinese-conundrum
Local governments are not the only ones with significant debt. With global interest rates low, many Chinese businesses (especially those with growing sales) in an expansionary stage, and the availability of relatively easy credit (particularly because a large, vibrant “Shadow Banking System” has developed to “fill in” where “official” credit sources refuse to offer loans) a great many Chinese corporations (both private and stare-owned) have borrowed quite freely over the years. In fact between 2008 and 2013, Chinese corporate debt (my data covers only non-finance firms) zoomed upward from just 85% of GDP to about 120% of GDP!! That increased use of leverage has placed China at the high end of the Debt vs GDP metric — relative to that same metric reported from within other emerging market economies.[17]
In fact, during the past couple of years, the Chinese government has attempted (however awkwardly) to curtail corporate leveraging. You may recall that in June of 2013, the People’s Bank of China (PBC) engineered a jarring “Cash Crunch” and then allowed interest rates to drift higher during the remainder of the year. Then in October of last year, the Beijing government stood by and watched the onshore bonds of Shanghai Chaori Solar Energy Science & Technology Co.  slip into default – the first post-1949 Chinese entity to default on bonds! Those two actions were an economic “shot across the bow” –warning Chinese companies to be more judicious in their use of credit![18]
Although I cannot point to any “smoking gun” proving a direct correlation between these fundamental Chinese economic challenges and President Jinping’s November 2013 declaration regarding the aforementioned focus upon “open markets”… anyone who has taken (and passed) Economics 101 will confirm that freely, effectively operating capital markets can exert a very positive influence within an economy. Among many other impacts, such markets enable the flow of new equity funds into corporations via stock ownership — thereby exerting a quite positive impact upon corporate financial metrics. In the case of the PRC, the most obvious impact would be an increase in equity vis-à-vis debt (thereby improving financial health and sustainability). Keep that thought at the forefront of your mind as you read further!
Between November of 2013 and the end of last year, government leaders, the State-controlled press, and financial/investment companies within the PRC embarked upon a campaign to stir up interest within its citizenry regarding equity investments within the Shanghai and Shenzhen Stock Exchanges. It really does not take much effort to stir hope within the imagination of human beings regarding the possibility of extra income – and perhaps even actual “wealth” – coming their way.[19] As we’ve already touched on, stock ownership restrictions were removed, and relatively liberal “margin” regulations were enacted.
To offer an illustration of this official “encouragement” regarding Chinese equity investment, here is a concise summary of what were (up until June 12th, at least) the margin regulations for Chinese investors:
1) A Chinese investor can borrow $1.25 for every dollar of cash she has
2) If she has $1 cash, she can borrow $1.25 for a total account size of $2.25.
3) If you divide the account value ($2.25) by the margin balance ($1.25) the result is a metric that Beijing calls a “Guarantee Ratio”).
a) In this case, that Ratio is 180%.
4) Alas, if purchased stock in a margin account declines in price, the Guarantee Ratio falls!
a) The broker is supposed to start issuing margin calls when a margin account’s ratio slips below 150% Ration.
b) If an account’s ratio slips further… to130% or below… a broker is supposed to force the closing of positions in order to pay down the loan.
You have already seen graphs of the upwardly parabolic curve of the Chinese markets between October (2014) and the middle of June. Margin calls were not a commonplace event in those heady days of market enthusiasm!
To summarize what we have just outlined for you, we have highlighted the following:
1) Xi Jinjing’s major policy shift announced in November of 2013 (at the Third Plenum) regarding greater dependence in China upon “open markets”;
2) A concerted public relations effort to persuade Chinese citizens of the considerable advantages of investing within the Chinese equity market;
3) Official provision of easily obtained margin credit for the purchase of Chinese equities.
What could a reasonable person have expected the result of these developments to have been?[20]
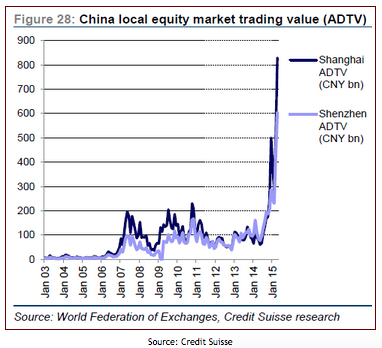
How could one be the least surprised by any of these graphs?
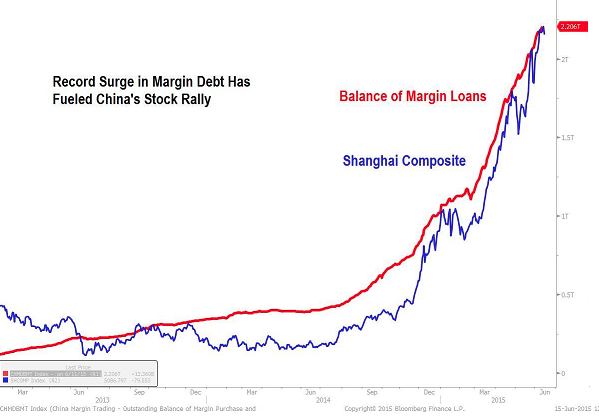
1) The amount of margin loans more than doubled in six months, to more than two trillion yuan ($320 billion).
2) Average Daily Trading Volume soared!
a) You may not know this, but “institutional trading”[21] dominates daily trading within most global stock exchanges.
b) That is not nearly as true in China. During the past 12-15 months, there have been some 30 million new retail trading accounts opened in China!
c) Those retail investors account for about 85% of trading volume on the Chinese exchanges. [Note that this point is in some dispute because of the many ways related metrics can be skewed. The point is that novice investors came “out of the woodwork” and opened up a stock brokerage account.]
d) In case I have not been clear, these new investors are “average” folks like you and me… but likely with little or no investment experience or expertise.
3) Let’s put the parabolic rise of Chinese equity prices (through 6/12) into perspective.
a) The “Aggregate Chinese Equity Market Cap” moved up to $10 Trillion.
b) Japan’s market cap is just half of that.
c) About 6-8 months ago, Chinese equities accounted for about 5% of the global equity market cap. By June 12th, that percentage had soared to a level in excess of 13%!
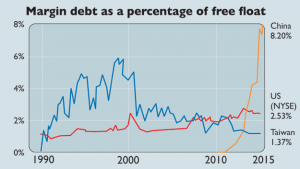
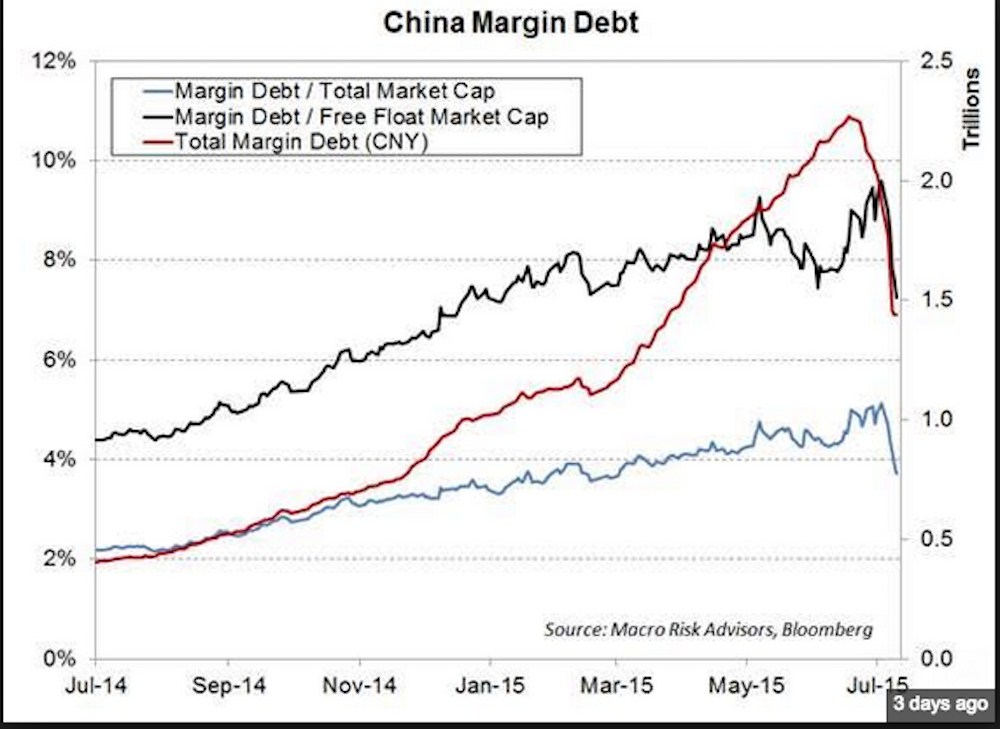
Add to this volatile mix outlined above the fact that, by June, almost 9% of the “free float” within the Chinese exchanges was predicated upon margin debt. That means that by the middle of June, the monetary value of the stock held in China that was purchased through margin debt was actually equivalent to the entire market capitalization of the Indonesian stock exchange!
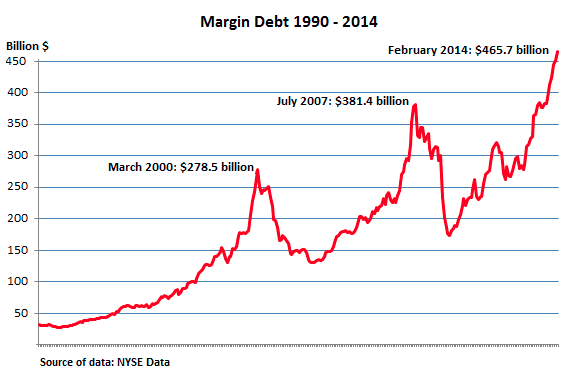
In case you have not yet fully appreciated the exponential growth of margin in China… here is a graph of growth in margin debt through the end of 2014:
Here is a view of the correlation of price surges and increased margin debt.
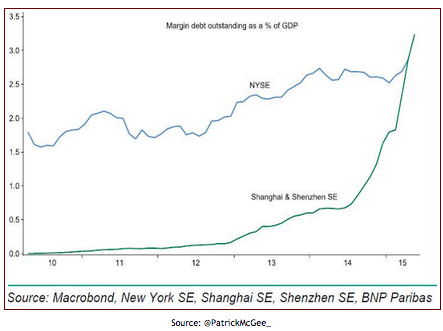
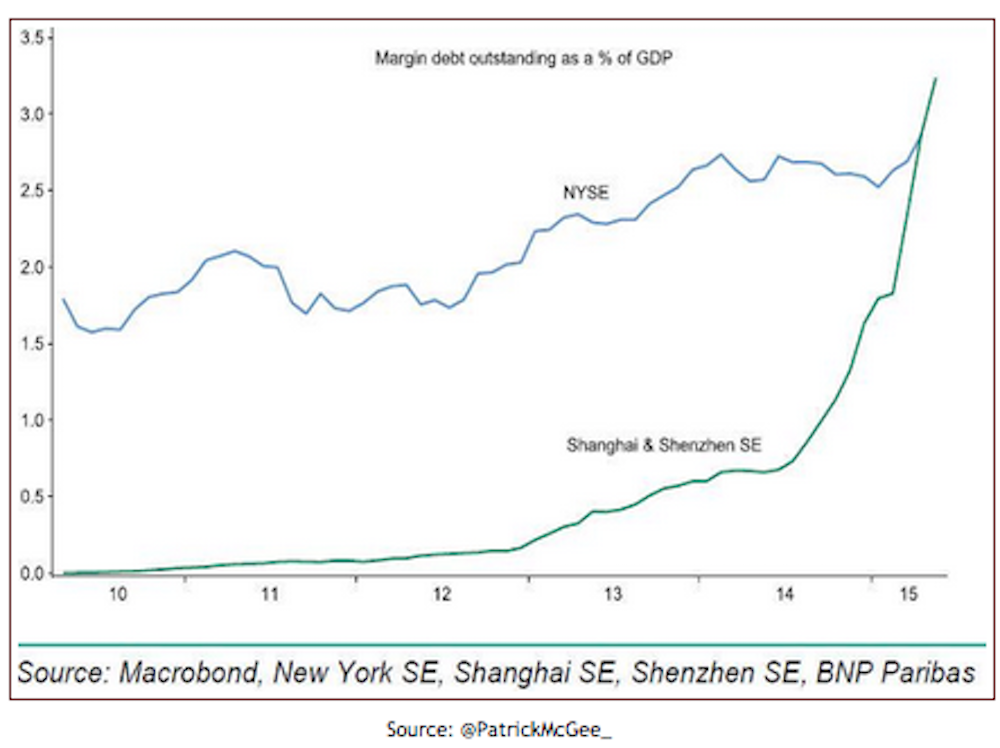
Believe it or not, friends, as a percent of “free float”, Chinese margin debt dwarfs the parallel metric in the United States.
Also very revealing is the volatility of the total amount/flow of Margin Debt in China during this period:
And for emphasis, allow me to repeat the earlier view of Margin Debt as a percentage of GDP!
INVESTOR TAKEAWAY:
The upwardly parabolic move of Chinese equities between October of 2014 and June 12th of 2015 was breath-taking. But as our regular readers have come to understand – free markets cannot continue moving upward that sharply forever. Anyone who profited throughout that nearly 9-month period has reason to be grateful. In fact, during this “winning streak”, the market gains must have felt more like casino winnings than normal portfolio appreciation.
In fact, that is precisely why the price action of the ASHR ETF during those months provided such a great basis for the “risk profile/money management” test with which I started this article. In that regard, I do need to caution each of us that the “answers” we provided to that test from a comfortable chair in our home would quite likely be different from the actions we would take within the actual excitement of a Las Vegas gambling casino. Whether on the main floor of the Belagio, or sitting in front of our trading computer at home – our own emotions can often become our worst enemy with regard to managing risk and making the sound money management decisions most likely to maximize our financial well-being!
With regard to money management, I promised a suggestion on page 1 of this article. Recall that at the end of Week One in Las Vegas, you had winnings of $4,825. Many experts suggest that, whether in gambling or in trading, it is wise to “capture” some of your profits as you experience success. By doing that, your remaining “risk capital” is reduced, thereby lowering your potential future losses — while simultaneously allowing you to continue to profit if the market keeps going up (as it did). As we witnessed, that strategy would have gained you more profit during Week Two, and if you had “banked” that profit as well, you would have experienced much less turmoil and disappointment during your remaining days in Las Vegas!!
We have witnessed what transpired on the Chinese exchanges between June 13th and July 8th. For millions of Chinese investors, it was more than painful—it was harrowing. And the depth of the terrible stress those investors experienced was magnified by the degree to which their accounts carried a margin balance!
Although we cannot yet know what the next few months will hold for Chinese markets and those millions of (relatively) novice investors – we can say with confidence that Chinese leaders did create the setting and dynamics through which this powerful bull market rally was generated.
The question you and I must each answer in our own trading is whether we feel we can trust the leaders and policies currently in place in the PRC with some (or even any) of our limited investment capital! I confess that I have not yet fully resolved that question in my own mind.
As you wrestle with that question, I strongly encourage you to watch for Part II – within which I will offer you a detailed review of what Xi Jinping and his administration in Beijing did between June 13th and today (July 16th). I know that long-time investors have become accustomed to the unexpected (and even bizarre) within stock, bond, and commodity markets. But I suspect that even some of the more battle-tested traders among us will be surprised by these recent developments within China!
DISCLOSURE:
The author does not currently own ASHR or FXI… or any other Chinese stock (although he has in the past). Nothing in this article is intended as a recommendation to buy or sell anything. Always consult with your financial advisor regarding changes in your portfolio – either subtractions or additions.
APPENDIX
Normally, I would publish the spreadsheet I created of the daily prices of ASHR between October and July. However, the spreadsheet is one of those “big, hairy” Excel files… so that it not practical. However, as a consolation, here is the graph of those prices:
FOOTNOTES
[1] Feel free to choose your favorite game of chance.
[2] A gain of over 75% in two weeks
[3] Or day-by-day
[4] I downloaded the data from YahooFinance.com
[5] When ASHR began a significant upward move in price
[6] “Halcyon” relative to today’s much more complicated world, that is
[7] Yes, of course we should all recognize educational curricula as a form of propaganda, indoctrination, opinion-shaping, etc. Every textbook writer, educator, school leader has a natural bias regarding what gets taught and how it is presented. It is unavoidable. However, that said, productivity figures from the 50’s and 60’s will verify the superiority of U.S. productivity vis-à-vis China or the U.S.S.R.
[8] Note that Deng was neither full-fledged party leader nor the Premier… but he did exercise ultimate leadership in China as the “Paramount Leader”.
[9] Investopedia.com notes: Included among “H-shares… are more than 90 Chinese companies, giving investors at least some access to most of the major economic sectors such as financials, industrials and utilities.”
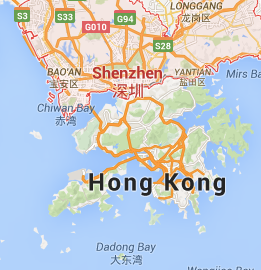
[10] Everyone knows where Shanghai is. But for those unfamiliar with Shenzhen, it is just north of Hong Kong.
[11] 9/15/2008
[12] Or at best, mentioned only in passing.
[13] Within the five-year cycles of each “Party Congress” – the “Third Plenum” is crucial for its announcements of major party policies or initiatives.
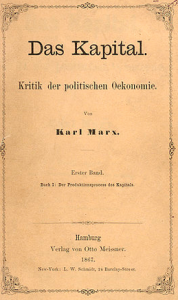
[14] The radical nature of that statement vis-à-vis an overview of Chinese Communist history and policy is almost certainly missed by anyone who has not studied Mao Tse Tung’s economic dogma or Das Kapital by Karl Marx. Here is an 1867 cover:
[15] This brief summary does not, in any way, do this subject adequate justice. I encourage you to read about the expansive details in articles like: http://blogs.reuters.com/great-debate/2015/04/21/the-myth-of-chinas-ghost-cities/
[16] There are almost 600 more cities in China today than existed when Mao Tse Tung took over the government in 1949. By far the great majority of these 600 new cities have sprung up during the past 35 years!
[17] One of the crippling limits on these articles is that “everything is more complicated that it seems”. The plain and simple truth that plays into almost everything about China is that during the past 7 years, the M2 monetary supply in the PRC has more than tripled!! This has been the result of Beijing’s commitment to stabilization through employment and ongoing economic activity – whether or not any given program functions positively according to economic theory! See William Huggins’ (Univ. of Toronto) streaming video: http://www.wsj.com/articles/everything-you-need-to-know-about-chinas-stock-markets-1436534913
[18] The implication was also that neither Beijing nor the PBC would bail companies out of trouble (sound familiar?).
[19] Just consider how expansive U.S. public participation has become within the seemingly endless and varied forms of the “Lottery” offered from shore to shore (and in Alaska and Hawaii). (And no one ever actually tries to promote that as an “investment” … because on an expectancy basis, It is actually throwing money away.
[20] The interaction of increasingly open markets, burgeoning interest among citizens in Chinese stocks, and easy credit (to “juice”) the markets.
[21] By which I refer to pension funds, endowments, hedge funds, and other professional managers of funds.
Related Posts
Also on Market Tamer…
Follow Us on Facebook

 Should You Buy Tractor Supply Stock Right Now?


