My adult daughter has invested (in a Roth IRA) from her first year of full-time employment, and has a keen interest in investing. But her job consumes so much of her time and energy that she can’t keep up with the markets. So let’s imagine she visited me one day and wanted a “MarketTamer Condensed Version” of current market trends. How would I respond?
My initial temptation would be to show her a picture of the U.S. Federal Reserve and the most recent two Chairs, Ben Bernanke and Janet Yellen – explaining that the Fed has more than quadrupled its balance sheet since 2007 and flooded the U.S. money system so full of dollars that (like water in a flood) those dollars had to move somewhere, so they moved into the stock market. (The “Interactive Graph” from Wall Street Journal can be accessed at http://blogs.wsj.com/economics/2013/09/17/a-look-inside-the-feds-balance-sheet-16/tab/interactive/).
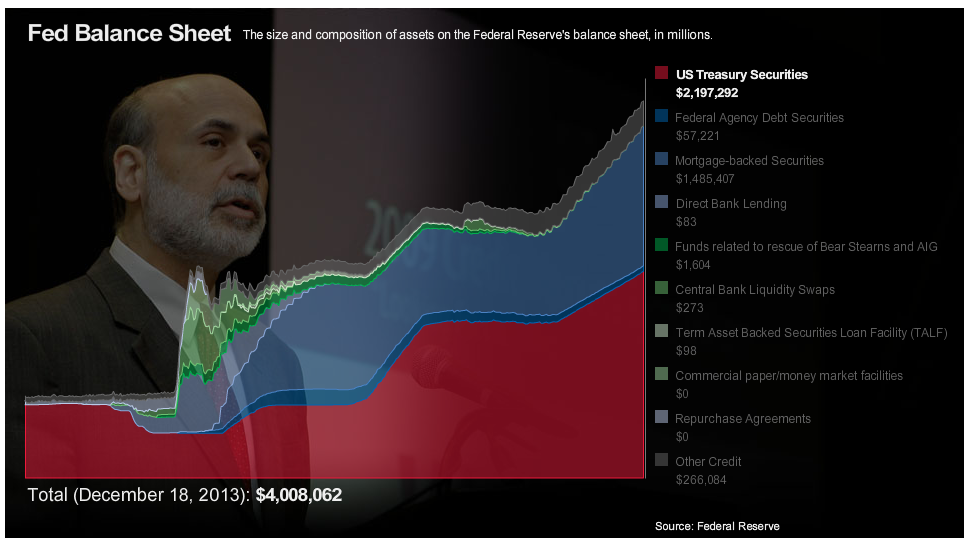
Between January of 2007 and December of 2013, the FED Balance Sheet was increased from $875 billion to over $4 trillion!
Note that on January 3, 2007, the Balance Sheet stood at $875 billion. As you can see above, by the end of 2013 it had climbed to $4.008 trillion!
The inevitable result of this “flood” of money has been a relentless bull market in equities, with the S&P 500 Index (SPY) moving up over 60% during the past three years, while the iShares Core US Aggregate Bond Market (AGG) has been flat – returning an annual yield between 2 and 3% (currently 2.2%).
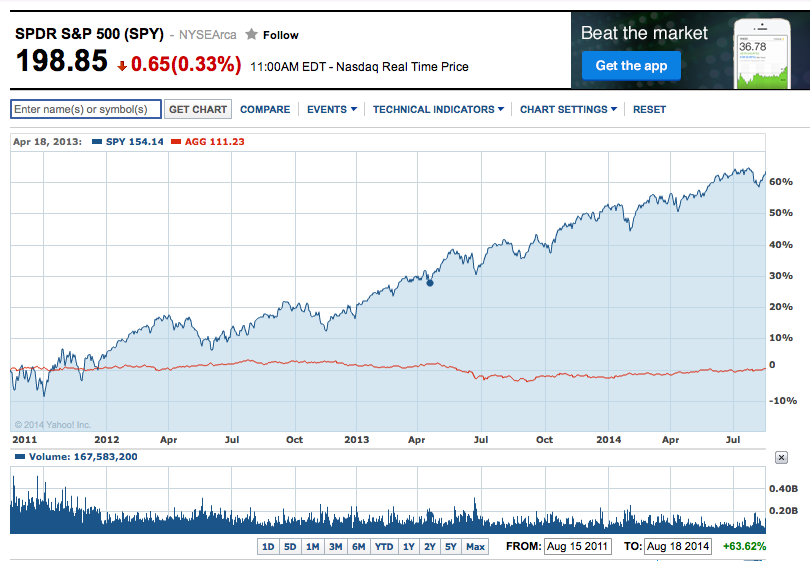
Over the past three years, SPY has been propelled higher by the Fed's "easy money policy", while the U.S. bond market has only managed to offer a return equal to its interest payments.
Within this bigger story, a fascinating trend this year has been the relative performance of the S&P 500, the NASDAQ Composite Index, and the Russell 2000 Index.
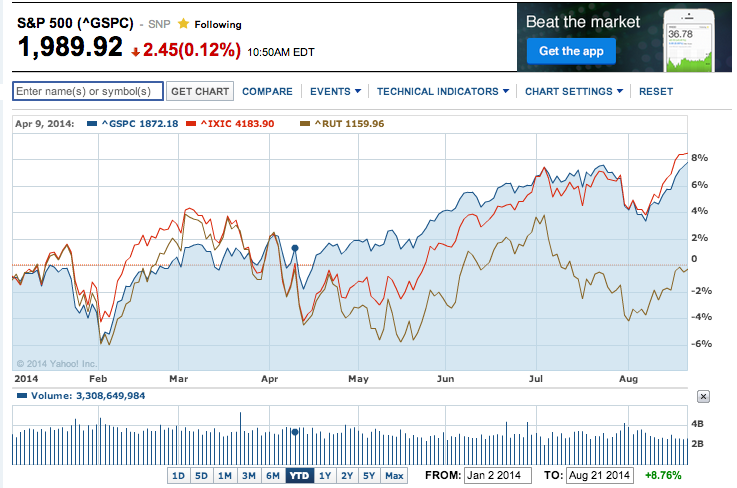
On a Year-to-Date basis, the RUT Index has lagged behind the S&P and the NASDAQ. During the past 3.5 months, QQQ has been outperforming the S&P.
The NASDAQ was “hot” between February and the middle of March, when it tailed off sharply into the middle of May… falling behind the S&P but largely tracking the “small cap” Russell Index. Those two indices stopped moving in lockstep toward the end of April, when the NASDAQ accelerated to catch up with and surpass the S&P! Therefore, YTD, while the RUT is slightly negative, the NASDAQ is up over 8% and the S&P has appreciated just under 8%.
Therefore it is clear that the NASDAQ Index has been significantly outperforming the S&P Index since Mid-April. During our weekly “review” of the market, that has been one of the most consistent trends (and even “themes”) of the market.
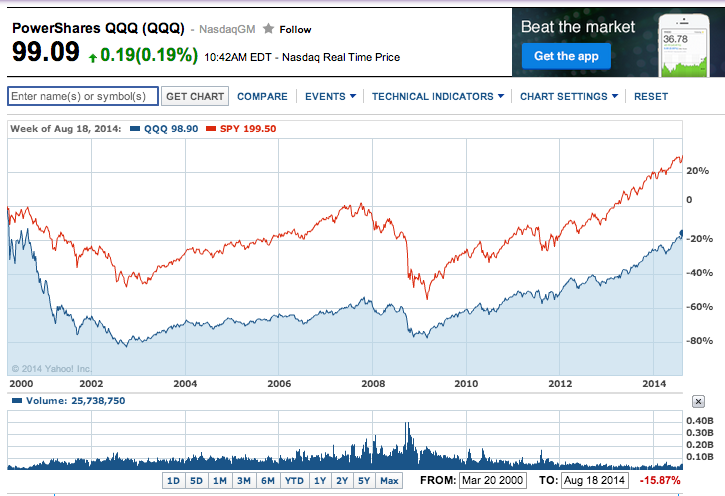
I confess that I had never ventured in any significant way into the NASDAQ. The reasons aren’t surprising, and may be fairly common. Take a look at these graphs from March of 2000 through today:
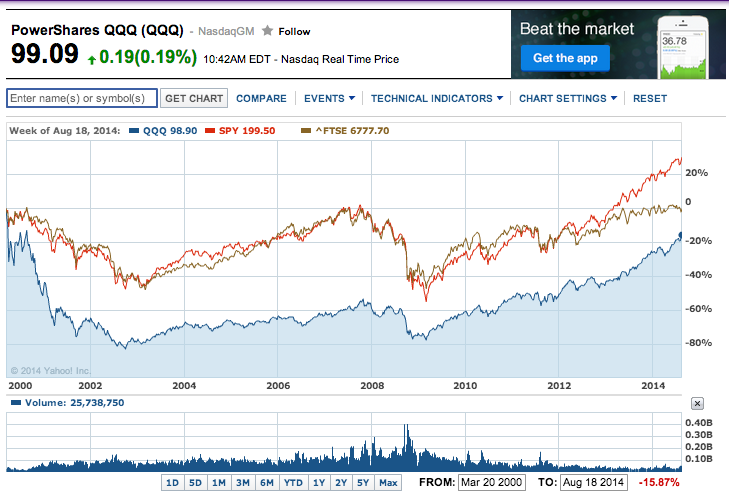
The NASDAQ (represented by the PowerShares QQQ ETF (QQQ) ) has underperformed the S&P (SPDR S&P 500 ETF (SPY) ) by almost 45% since March of 2000! That is why, for months now, we’ve been hearing about the S&P and the Dow topping “all-time highs” – but not the NASDAQ. In fact, I have noticed some reporters struggling with exactly how to describe NASDAQ’s current levels… since they have been 52-week highs, but not yet “all-time” ones!
We know that the European stock market is (overall) still relatively “cheaper” than the U.S. market, since the U.S. market has been driven so strongly by the Fed. And yet the above graph shows that the NASDAQ has underperformed even the FTSE 100 Index (brown).
If we “zoom out” and take a 15-25 year look at “the Market”, the explanation behind these seeming market anomalies is simply “Reversion to the Mean”. The NASDAQ was the main focus for the infamous “Dot.com Bubble”… a trend that was all too soon transformed into the “Dot.com Crash”.
The following graph is a telling image of just “out of control” tech stocks got between 1998 and March of 2000. The truly amazing thing is that there actually were analysts and commentators back in that day (seemingly in control of all of their mental faculties) that kept justifying the inordinate stampede into the “Dot.com” space. Those folks kept assuring investors that “things are different this time”… “we are in a new era”. They suggested that we throw out time-tested measures of “value” (such as P/E Ratios… and even “profits”) because they did not apply to emerging tech company stocks!
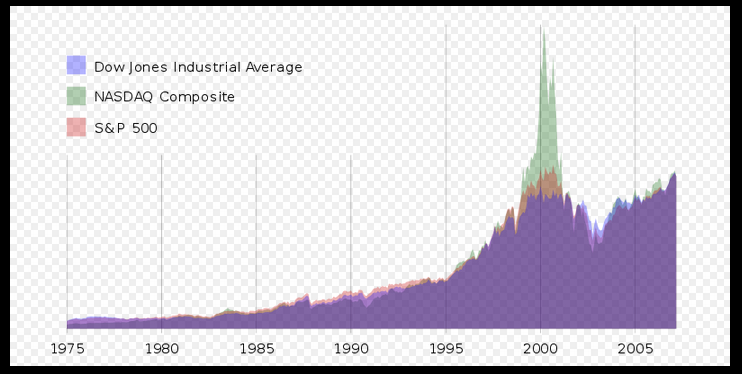
This is a view of the NASDAQ vis-a-vis the Dow and S&P 500 leading up into (and beyond) the "Dot.com Bubble".
What a bunch of hogwash!
To help those of you who don’t vividly recall those heady days, here are NASDAQ “milestones” within the “Dot.com Bubble” between July of 1998 and March of 2000. I marvel at how quickly the Index ran up… but that is (by definition) “a Bubble”, isn’t it?!
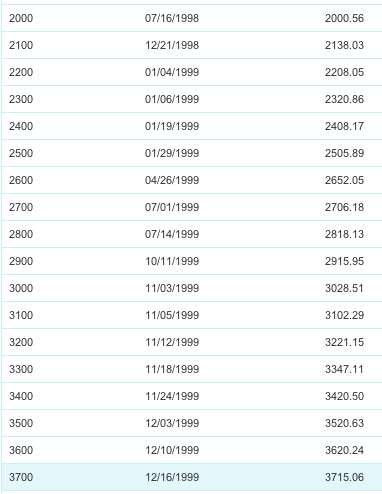
Review this slide carefully and notice how rapidly the NASDAQ was reaching new price "Milestone" from 1998 onward.
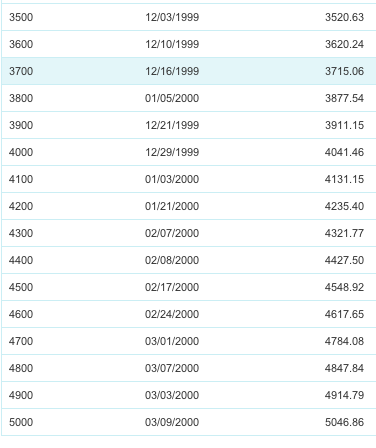
This list completes the "Milestones". The rapidity of the NASDAQ's rise and the depth of its fall were equally memorable!
The NASDAQ zoomed higher by an astounding 152% in just 20 months!!
The analysts’ reassurances during those days that “this time is different” sound absolutely absurd in light of the above, don’t they?[1] The truth is that time-tested “investment principles” very rarely “expire”… or lose their validity!!
Well, we know the result… big-time “Reversion to the Mean”!! In fact, the relative performance chart for QQQ vs SPY since March of 2000 is a “relic” of the “Dot.com Bubble”… as well as the fact that the NASDAQ Index has not yet reached an “all-time new high”!
If you want to track the progress of QQQ toward a new high, here are the figures I pulled from YahooFinance.com :
QQQ was at $117.56 (closing high) in March 2000;
QQQ reached as high as $98.88 intraday on August 21, 2014.
In light of all of the above, I decided to highlight a few different ways an investor can gain exposure to the NASDAQ Index. In that regard, I have great news for you! There are a wide variety of ways for you to design exposure to the NASDAQ – a variety wide enough that most folks will be able to find one or more NASDAQ-related ETFs that will conform to their particular market view and risk parameters!
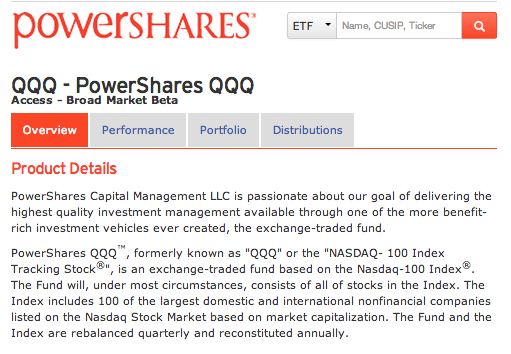
Let’s take a look at the biggest of these ETFs: the PowerShares QQQ ETF (QQQ). This ETF tracks the NASDAQ-100 Index – which includes 100 of the largest domestic and international non-financial companies listed on the NASDAQ Stock Exchange. The ETF is a weighted by market capitalization, and the ETF (and Index) are rebalanced quarterly (and reconstituted annually). It is worth noting that most of the stocks that compose the top ten holdings of QQQ have been strong during the past 3 months – with just one exception: Qualcomm (QCOM) has moved down in value during that time! It is also helpful to remember that those top ten holdings comprise about 51% of the total value of the ETF – so QQQ is rather “top heavy” (as so many market cap weighted ETFs are).
Below is a list of the top holdings within QQQ. Those of you who have the market capitalization of the biggest U.S. companies committed to memory will immediately recognize that the weight of stocks within QQQ does not strictly conform to market cap. That is precisely why the ETF is described as using a MODIFIED cap weighting![2]
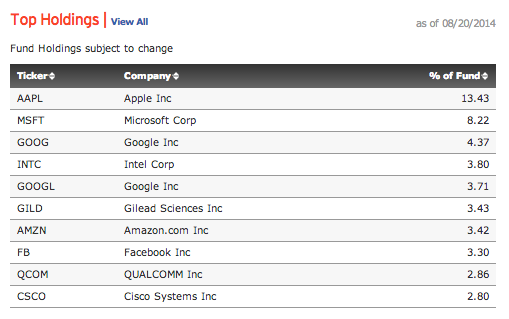 For a stock to qualify for listing in the NASDAQ 100, it must meet the following criteria:
1) Nofinancial stocks are allowed.[3]
2) It must have been listed for at least 2 years… except (you guessed it) some high profile stocks (with regard to capitalization), whose requirement is just 1 year!
3) Stock also needs to:
a) Trade at least 200,000 shares daily;
b) Report quarterly and annually;
c) Be free of bankruptcy issues.
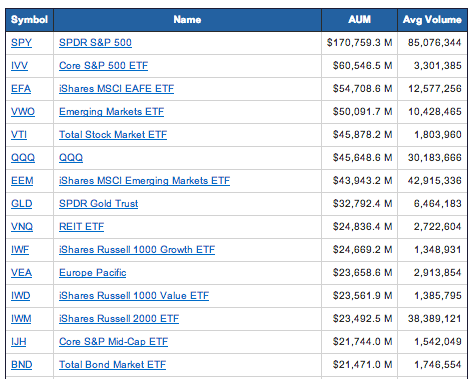
QQQ is huge by ETF standards. As we see below, with regard to Assets Under Management (AUM) it is (practically speaking) in a tie for 5th with Vanguard Total Stock Market ETF (VTI).[4]
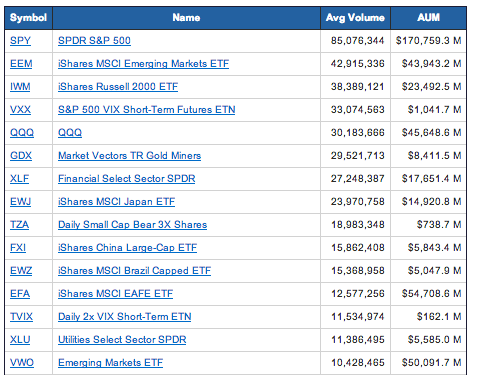
With regard to Average Daily Trading Volume, QQQ is the fifth highest among ETFs – which means it is very liquid and should have tight bid/ask spreads! It trades just a bit less volume than VXX and a tad more volume than GDX.[5]
Highlighting how NASDAQ has outperformed the other primary equity indices during the past four months, on Monday, August 18th, about 20 ETFs hit significant new highs… and four of them were tied to the NASDAQ. Three of those ETFs are:
QQQ
QLD ProShares Ultra QQQ (ETF)
TQQQ ProShares UltraPro QQQ (ETF)
QLD is the Bullish double-leveraged ETF for QQQ, while TQQQ is the Bullish triple-leveraged ETF for QQQ. As you have heard so often before, be very aware of what you are getting if/when you investment (long or short) in a leveraged ETF. You are not only buying higher volatility… but even if you buy the ETF stock (as opposed to options on either leveraged choice), you will likely experience some price deterioration due to the math involved in recalculating the ETF’s value each day!
Of course, there are ETFs that reflect the “Inverse” performance of QQQ! Suffice it to say that those ETFs have not reported a new high for a long time!
QID ProShares UltraShort QQQ (Double Inverse ETF)
SQQQ ProShares UltraPro Short QQQ (Triple Inverse ETF)
The fourth NASDAQ-related ETF that rose to a new high on August 18th was
QQXT FirstTrust NASDAQ Ex-Technology Sector Index Fund
Yes, imagine that!! A NASDAQ ETF that excludes technology stocks! Of course, the irony there is the most commonly used adjective when referred to the NASDAQ or QQQ is – “tech heavy”!! And that adjective is used with good reason! Look at this:
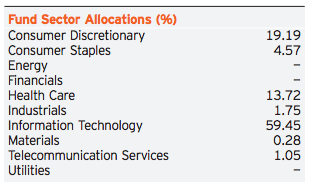
No one can question that QQQ is "tech heavy". IT accounts for almost 60% of the "Sector Weighting"... while the 2nd highest sector accounts for just over 19% (Consumer Discretionary).
Offhand, I’d say that a 59.45% weighting in IT qualifies QQQ as “tech heavy”!!
This might cause you to wonder how a NASDAQ based ETF that excludes technology could possibly have been a top performer … simultaneously with QQQ’s solid performance.
Well, the answer is simpler than you think, and we’ll get into that in Part II, when we highlight some other ways in which ETF providers “slice and dice” the NASDAQ Index to suit the market perspective and risk parameters of an investor!
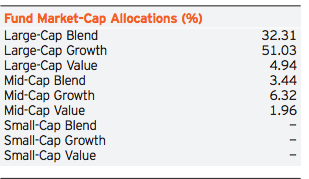
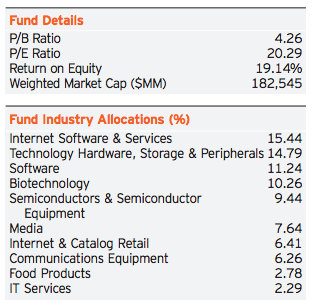
Finally, here are a couple of slides that list key metrics for the QQQ ETF – an ETF characterized as Large Cap Growth, with a bit higher P/E than that of the wider U.S. stock market.[6]
The aversion of some folks to investing in the NASDAQ Index can have many roots – including horrible memories of losses following the “Dot.com Bubble”, some of the extremely unflattering articles written about how poorly the NASDAQ Exchange has handled some high profile matters (the Facebook (FB) IPO disaster being chief among them!), or merely because there is so much more attention showered upon the S&P and Dow Indices!
If you have not had the opportunity to become as conversant with the NASDAQ as you are with the older, more “storied” indices, I hope this article has helped peek your interest in the NASDAQ and made you more comfortable with it! It can hardly be questioned that, based merely on valuation, the NASDAQ is considerably more attractive as an investment option than the Russell 2000 (per Footnote 6)!
There are a number of positive features of the NASDAQ, including (but not limited to):
1) The NASDAQ incorporates some of the strongest, most innovative, most interesting corporations in the world today (AAPL, MSFT, GOOGL, INTC, AMZN, FB, GILD, AMGN, CELG, BIIB, EBAY, PCLN, SBUX, BIDU, COST, etc.).
a) Investing in QQQ is a much more diversified way of investing in these contemporary icons than investing in any one of them alone!
b) The broker commissions are lower investing in just QQQ than investing in a mix of a number of QQQ’s individual components.
2) Because QQQ is so liquid, it is more tradable, with tighter spreads, in both slow and “fast” markets.
a) In similar vein, one can employ a variety of option strategies connected with QQQ … while benefiting from solid liquidity and lower spreads.
3) Because the Index includes no financials, you never risk waking up in the morning and discovering that a major component of your ETF has been fined heavily (think $13-17 B) for ripping off United States home owners… as has happened with the past couple of years to J.P. Morgan Chase (JPM) and Bank of America Corporation (BAC).
In Part II, I will suggest a number of additional intriguing ways for investors to trade (or invest in) NASDAQ-related ETFs!
DISCLOSURE: I have traded QQQ in the recent past. I currently hold a closed-end fund related to the NASDAQ (Nuveen NASDAQ Premium Income & Growth Fund (QQQX)). Nothing in this article is intended as a recommendation to buy or sell anything. Always consult with your financial advisor regarding changes in your portfolio – either subtractions or additions.
FOOTNOTES:
[1] In some ways, anyone who was fully educated and certified as an investment professional who was willing to cavalierly disregard time-tested standards of valuation could be considered “negligent”!
[2] If QQQ did conform to strict market cap, the weighting of AAPL, MSFT, and GOOGL would reflect these figures:
[3] Many consider that a key positive feature of the NASDAQ 100!
[4] Note that SPY is so huge that it holds almost three times more assets than second-place IVV …and almost four times the assets of QQQ.
[5] Once again note how huge SPY is relative to the others. Over twice the average daily volume of any other ETF, and almost three times the volume of QQQ
[6] Here is an eye-opening chart from today’s Online Wall Street Journal. Can there be any doubt WHY the RUT Index (Russell 2000) has been trending downward. The current economy has not been “friendly to them in keeping earnings up with price appreciation. It is a VALUATION issue!
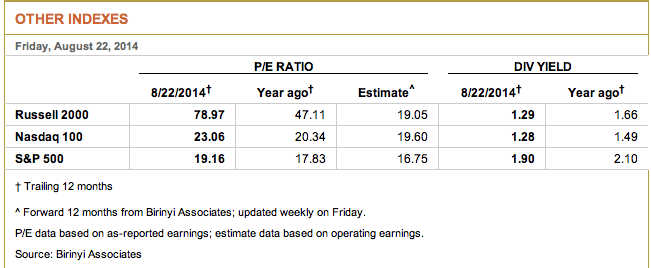
This slide offers a stark insight regarding why the RUT Index has been underperforming the NASDAQ and the S&P over the past five months!
Related Posts
Also on Market Tamer…
Follow Us on Facebook


 2 Ultra-High-Yield Dividend Stocks You Can Buy and Hold for a Decade
