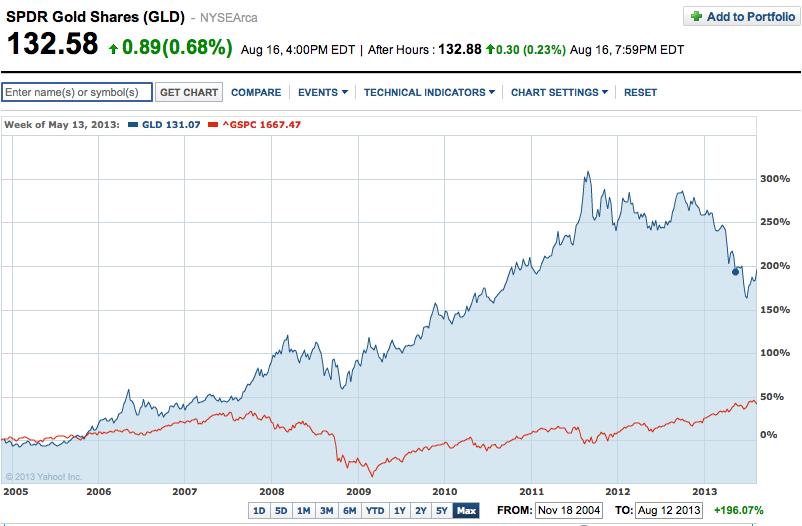
In my estimation, one of the most interesting and compelling world-wide investment stories of the past decade has been the story of Gold, traded most commonly within the stock and options world through the ETF SPDR Gold Shares (GLD). During the twelve years prior to August of 2011, it was “common knowledge”[1] that (at first) a hot real estate market (into 2007) and (later) an extremely accommodative monetary policy within the U.S. and Europe made an increase in the price of gold inevitable. As too many of us vividly recall, during 2010 and 2011, countless voices regularly trumpeted that the “next target on gold is $2000/ounce!”[2]
For anyone who suffers from a severe memory challenge, here is an eight-year graph of GLD (blue) dating back to 2005. That “bull market” was very impressive! Not even the 2008-09 financial crisis could shipwreck it!
When one contrasts the blue “mountain” (GLD) with the red valley (S&P 500) (bottoming early in 2009) the price action on GLD becomes even more impressive!
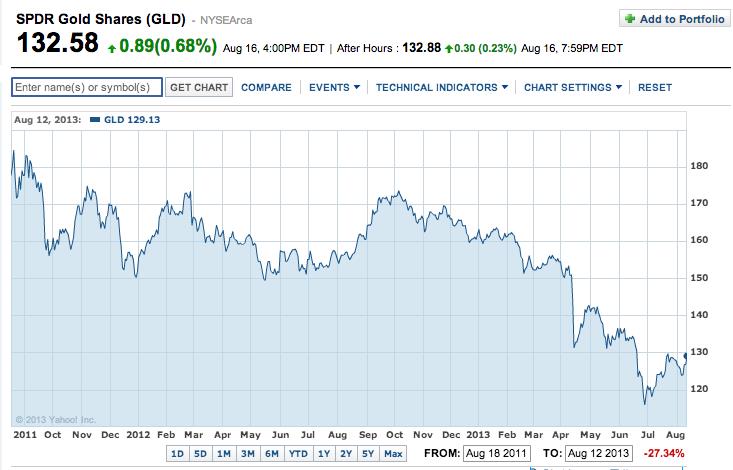
Unfortunately, no matter how “inevitable” gold’s rise might have seemed between 2005 and 2011, “Ms. Market” never likes to be taken for granted! Through countless centuries, the “market” has done only one thing with pernicious certainty and consistency: proven countless overly-confident investors that she/he was absolutely wrong!
One look at the following graph establishes how gold bulls came face-to-face with that particular eternal truth!
Between August 22nd of 2011 and June 27 of this year, GLD declined in price by 37.2% — that is an average monthly decline of almost 1.7%!
That extended move was convincing enough to this former “gold bull” to prompt me to attend several sessions of “GLD Bulls Anonymous” — in a valiant attempt to steel my discipline and help me curb my innate urge to be delta long GLD (as well as several mining stocks).[3]
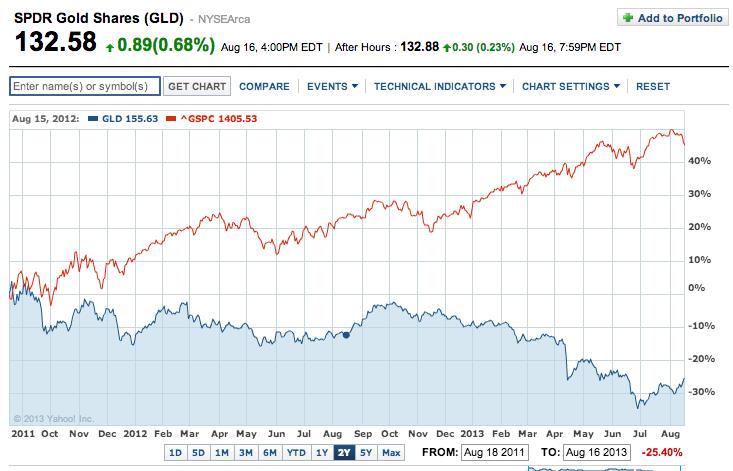
Adding to the growing sense of frustration that was shared by all true gold “bugs” was the implication of the following graph, which shows the prior two-years of S&P 500 Index (red line) price action vis-à-vis that of GLD (blue shading):
The relative price movements within the index versus that of GLD were far from being a “mirror image”. However, the widely divergent paths in price were dramatic and persistent over that two-year period. For all those “convinced” of the compelling fundamental reasons for GLD to outperform equities, every dollar of investment in GLD represented not only an “absolute” loss, but also a significant “opportunity cost”! [4]
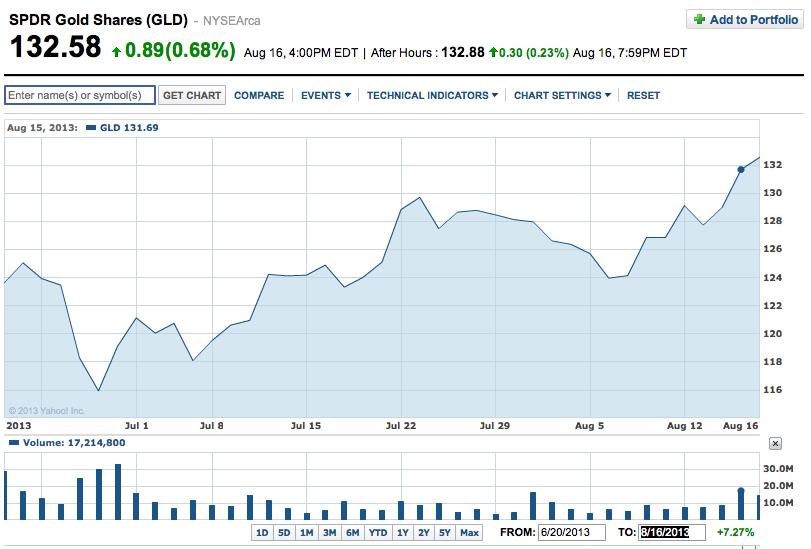
All of that being said, the price action since June 27th has been quite impressive (see graph below):
Between late June and August 16th, GLD moved upward by almost 14.4% (in just 35 trading days!)
Of course, no one knows precisely where GLD is headed from here. However, we can brainstorm a list of various trends and developments that have converged to bring us to this juncture. Then we can review these various threads of economic and investment news, with the hope that we will thereby be able to project the future of GLD with more confidence and acuity!
I) One dramatic (and thereby obvious) trend has been a change in investment flows:
a. Before August, the outflow of funds from GLD was so sizable and persistent that GLD lost its long held status as the second largest ETF in the U.S.! (The largest ETF is the SPDR S&P 500 ETF Trust (SPY));[5]
b. During this year’s first seven months, BlackRock reports that the ETF with the largest total funds outflow was GLD – losing $19.8 billion.
c. Although global ETFs pulled in $44.1 billion in July, GLD lost $2.6 billion (at least that was less than the $4.3 billion it lost in June!).
d. During the first two reporting periods of August, that outflow continued: a) Week ended August 2: – $368 million; b) week ended August 9: – $310 million.
e. However, during the week ended August 15, GLD was the ETF with the fifth largest inflow of funds: $195.50 million!
II) The power of the economic laws of supply and demand:
a. By the time GLD (and gold futures) traded at its low in late June, gold was being priced below its estimated marginal cost of production;
b. Recently, gold futures have been trading in “backwardation”[6] for the longest period on record (since COMEX began tracking that in 1975);
c. That is just one illustration of the disproportionate strength demonstrated through the sales figures for physical gold;
d. According to the World Gold Council, last quarter sales of gold bars and coins reached record levels.
III) News that a couple of prominent, long-time major holders of gold actually unloaded some of their GLD did not roil the markets!
a. Hedge Fund manager, John Paulson, who may be the most visible (and vocal) “gold bull” we know, has been a well-publicized holder of over 21 million shares of GLD;
b. While other “big name” holders steadily dropped their allocation to gold, Paulson has hung on, despite (for example) losing $736 million in 2013 Q2 alone;
i. Recently, through a 13F filing with the SEC, we learned that Paulson finally sold 12 million shares;
ii. However, he maintained his gold weighting by buying gold swaps.
c. The University of Texas (UT) has (as of 2011) the third largest endowment fund among universities in the U.S.[7]
i. UT created shockwaves in between 2007 and 2011 when it started accumulating a substantial position in gold;
ii. I describe that news as a “shockwave” because university investment boards are notoriously conservative;[8]
iii. Earlier this year, it was reported that UT sold $375 million of gold bars, but it did not cause shockwaves on Wall Street;
iv. Once again (like Paulson) they had not changed their investment outlook, but decided to free up cash by selling the bars to purchase enough gold futures to maintain the (effective) size of their gold allocation, with enough left over to purchase $225 million in developed market equities and $75 million of emerging market equities.
IV) Continued buying of major amounts of gold by a number of central banks.
a. In May, Bloomberg News reported that, in April, Russia and Kazakhstan had expanded their gold reserves for the seventh straight month in April;
b. According to the World Gold Council, central banks had consistently been sellers of gold for some 20 years – between 1991 and 2011. That tide turned in 2011, when they became net buyers of gold;
c. According to UBS, since 2011, central banks have gobbled up gold at an average monthly rate of 27-metric tons[9] – with Russia and South Korea among the most active purchasers;
d. Earlier this year, Bloomberg reported Alexandra Knight’s view on central banks’ interest in gold (Knight is a National Australia Bank, Ltd. economist): “We expect the trend of central bank buying to continue, especially in the emerging economies. While expectations are for lower prices at the end of the year, physical demand, especially in Asia, has been very supportive.”
e. Besides Russia, Kazakhstan, and South Korea, other major central bank buyers this year have been Indonesia, Bosnia, Herzegovina, and Azerbaijan.
I know that this has been a lot of information for you to absorb, so I am going to pause here and give you time to swirl all of this around in your head for a bit. I’ll be back in just a bit with Part II, in which I will offer two particular views on why gold (and GLD) has turned the proverbial corner. In addition, I’ll suggest that you consider one other investment fact about gold as you contemplate its future trend(s) and what that might mean (if anything) for your portfolio.
INVESTOR TAKEAWAY: If during the past two years, you have experienced any of the figurative “whip lash” that has plagued my option trading within the precious metals space, this may (or may not) be an appropriate point for you to step back, take a lingering look at the charts and trends provided here for your review, and then consider what gold’s future might hold.
One of the many benefits of being related to Market Tamer is your access (through classes, webinars, using the website to ask questions, etc.) of lower risk strategies to help you design an effective investment approach toward gold (GLD).
Disclosure: The author is an established “sucker” for bullish positions in precious metals. He currently holds option positions in GLD and shares of iShares Gold Trust (IAU). Nothing in this article is intended as a recommendation to buy or sell anything. Always consult with your financial advisor regarding changes in your portfolio – either subtractions or additions. And in the words of an old TV Show named “Hill Street Blues”: “Be careful out there!”[10]
Submitted by Thomas Petty MBA CFP
[1] This characterization is my own creation, and is not meant to indicate that literally everyone agreed with the stated premise, but rather that watching the price of gold move steadily upward during that long stretch of time led to an increasing number of experts acknowledging a “gold bull market” as though it was never a surprise to them!
[2] It fascinates me that, even today, TV/radio commercials from gold coin/bar sellers basically tout the same theme: (to paraphrase) “ rise of gold prices is inevitable; buy now or otherwise you might be too late!”
[3] My portfolio was not big enough to continue allowing red ink to flow freely from the “Long Term Metals” portion of my account!
[4] Said investor passed up the “opportunity” to invest that “dollar” into equities, short-term high yield bank loans, high yield bonds, or some other profitable choice!
[5] At the end of July (per IndexUniverse) GLD was the fifth largest ETF, just $2.1 billion ahead of PowerShares QQQ Trust, Series 1 (QQQ).
[6] A complex concept: For details, see http://www.investopedia.com/terms/b/backwardation.asp
[7] $17.149 billion was the 2011 balance.
[8] The graduate school for which I served as CFO had an investment committee whose members considered “Hedge Fund” a four-letter word!
[9] Equivalent to about 9.5 million ounces of gold.
[10] Particularly when/if you trade GLD!
Related Posts
Also on Market Tamer…
Follow Us on Facebook


 Is IonQ Stock a Buy?


