If you, like millions of CNBC viewers and countless stock sales professionals, find “Thematic Investing” appealing, here is an investing idea for you: a stock that combines all of the following:
1) China
2) Technology
3) Energy
4) Sustainability
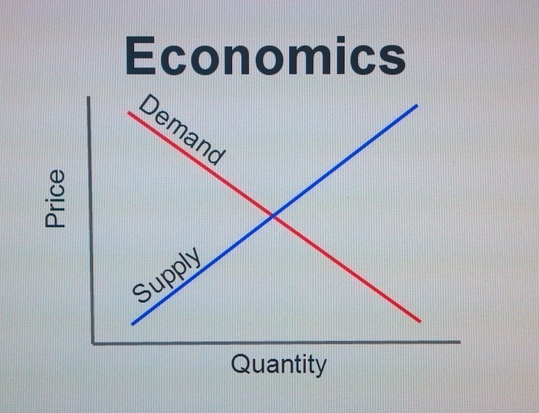
5) A great lesson in the timeless power of “Supply and Demand”
6) The danger of “Investor Sentiment”
7) (And, of course) Elon Musk!
How can anyone resist the inexorable pull of an investment to which one can attach so many attention getting themes??!
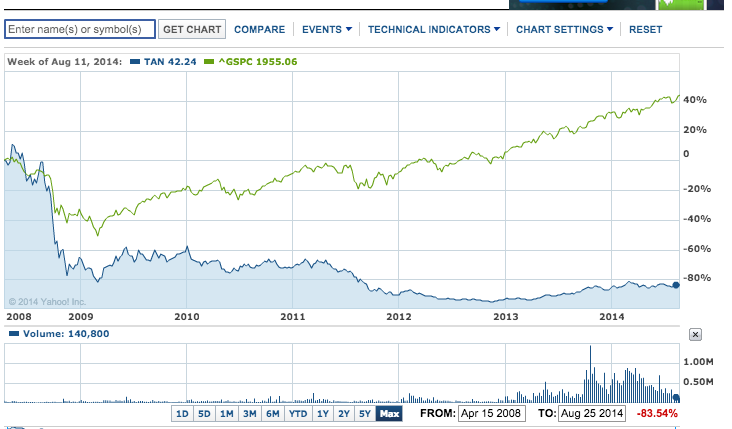
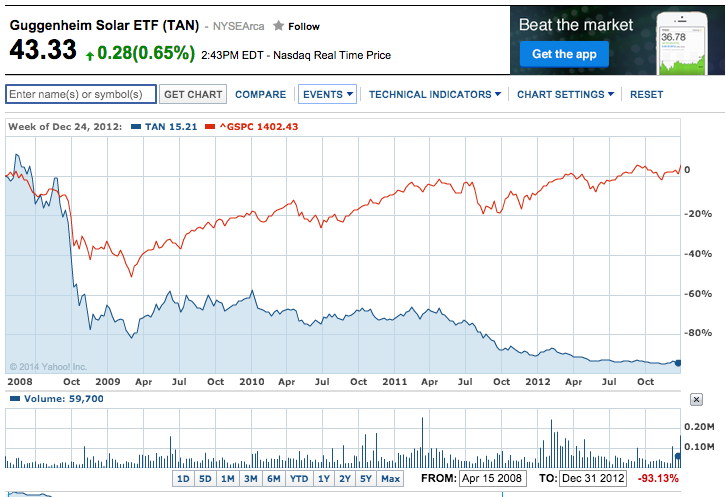
Now that I have you pumped up and ready to “buy, buy, buy”, let’s just move ahead to show you the price graph of this investment vis-a-vis the S&P 500 Index, since April of 2008:
Are you impressed yet?
No?!!
Why not??!!!
Ah, so your problem is that you noticed that the S&P 500 Index is the line in Green… while our new exciting investment vehicle is the one in Blue!!
Now what a minute, folks! There is absolutely no justification for you to start being rude by calling me names and suggesting (in off-color ways, no less) that I have “totally lost it”.
All I can say in response is: “Au contraire mon frère, ma soeur! Je vois la photo parfaitement ! J'ai trouvé !” [1]
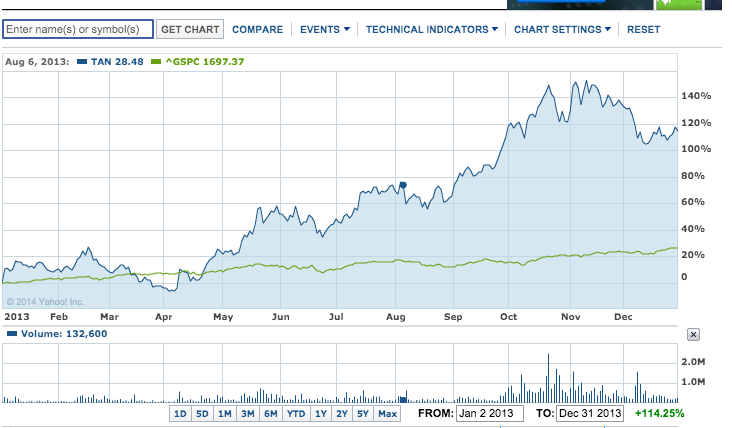
Here is the same graph as the above, except that it covers only the 2013 Calendar Year:
So let me ask:
Would you rather have profited by 120% during 2013, or matched the (approximate) mere 22% return of the S&P 500?
Ah, so now I am not so crazy!
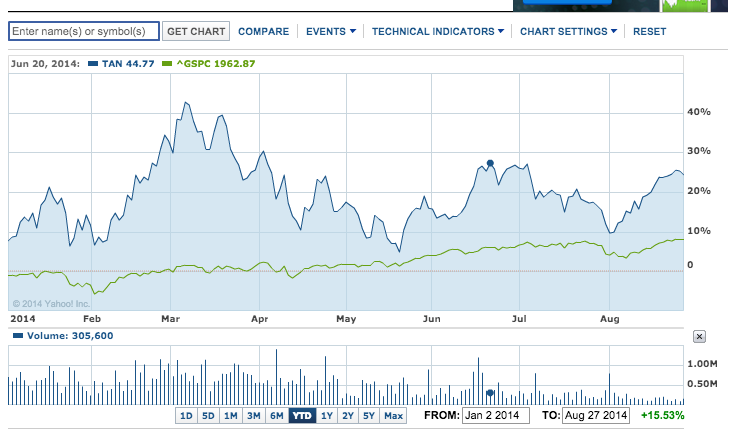
Although the performance differential has not been nearly as startling so far in 2014 (YTD), our investment vehicle has still outdone the S&P (about 24% to 9%):
What type of investment are we talking about here? It is Solar Energy, represented through the ETF: Guggenheim Solar ETF (TAN).
In order to make any sense of this investment space, I need to retrace some of the history of this industry. In the process of doing that, you’ll see how the themes I referenced earlier fit in!
The initial rollout of TAN came in April of 2008. In those “heady days” of the solar industry, investor enthusiasm far outweighed the economic health of that industry! The industry had two things going for it… and only two things: 1) the ecological “pizzazz” of Green Energy Generation; and 2) Federal (and some state) government subsidies.
Solar power installation only made economic sense within limited settings, and a realist would understand that government subsidies could not last forever. However, the “story of Solar” caught fire and investors practically threw money at solar stocks! During 2008, the highest closing price for TAN was $294.90. Then by November, TAN tanked to as low as $55 (11/20/08) and closed at $87.70 on December 31st.[2] By March 3rd of 2009, it moved down further to a (then) new low of $48.30. As a consequence, if you love roller coasters, you loved being a TAN shareholder.
There were three main problems with the solar economic model in the U.S. back then (In the early years, solar investment was heavily concentrated in the U.S., Germany, and Japan.):
1) Solar firms in the U.S. and Europe chose[3] thin-film technology for their installations;
2) The energy generation costs from solar were 3 to 5 times more expensive than mainline energy sources;
3) Chinese solar companies arose as a competitive force:
a) By 2009, the Chinese government announced a solar power incentive scheme;
b) The President of China gave a speech at the U.N. (on 9/20/09) pledging that China would secure 15% of its energy from renewable sources by 2019.
Whatever portion of the solar industry’s health was not crippled by the worldwide recession that started with the collapse of Lehman Brothers in 2008 was definitely hammered by the third factor above (the entry of Chinese solar producers). The impact of this development was compounded by the choice made by those firms to depend upon a different technology: silicon panel solar.
There is a very long and technical “back story” to how the economics of “thin film” vs. “silicon panel” played into the history of solar technology between 2008 and 2012. However, I am not an engineer and would surely fall far short of an accurate description of the details involved. So let’s just think of this issue in terms of supply and demand.
At the time that U.S. and Euro firms chose the thin film technology, the costs related to silicon were relatively prohibitive. Therefore the decision to use thin film made economic sense. However, once the Chinese government threw its full political weight (and its trillions of global financial reserves) into a massive building plan, with a high priority placed upon green energy, and heavy subsidies for solar vendors, the existing solar industry was deeply shaken! [It is well worth your time to watch this short video regarding the magnitude of the Chinese building boom… leading to so-called “ghost cities”: https://www.youtube.com/watch?v=rPILhiTJv7E.]
Just think of these economic inputs:
1) Heavy government subsidies;
2) Low barriers to entry;
3) Lots of companies sprang up, producing solar panels and competing for solar installations;
4) The cost of solar energy generation remained significantly more costly than energy produced from coal, gas, nuclear plants, etc.
The natural and obvious consequence of the above was:
1) The entry of massive production volume in China led to silicon panel technology becoming extremely competitive;
2) The flood of players entering the solar installation and solar panel production businesses led to a crippling level of excess capacity. Therefore, prices collapsed.
3) The solar panel business became a money loser for all but a small number of firms.
a) A corollary of this point is that countless firms were driven out of business.[4]
b) Calling this period an “Industry Shakeout” would be a gross understatement!
4) During this era, the “Solar Industry” was in the business of creating “sustainable energy”… but the industry itself was built upon a woefully UNsustainable business model!
It should be no surprise, therefore, that solar stocks absolutely “stunk” as an investment in those early years. Here is a graph of TAN between its inception and the end of 2012, with the red S&P 500 Index included to illustrate just how dismal TAN’s performance was:
Compounding this description of the struggles of TAN, consider the following:
1) During 2011, TAN lost two-thirds of its value;
2) By February of 2012, it was trading as low as $3.50/share.
a) Many U.S. stock exchanges consider it problematic when a stock continues falling below $5/share.
b) Therefore, on February 14, Guggenheim carried out a 1-10 “reverse split”[5]
At this point, you may be wondering: “That’s fascinating, Tom. But remind me why on earth I’d ever want to invest in solar technology. So far, it sounds like buying solar stocks resembles putting money (chips) on a roulette table in Las Vegas. That is not for me!”
I’m glad you have understood all that I have shared above!
You’ll also notice that (in fact) I have covered all the investment themes I promised at the beginning of this piece – except (that is) for Elon Musk. But isn’t he just the co-founder of PayPal and current CEO of SpaceX and Tesla Motors (TSLA)?
Actually, in Elon’s spare time, he also serves as the Chair and dominant shareholder of Solar City (SCTY) [see last year's article at https://www.markettamer.com/blog/deal-of-a-lifetime-or-dangerously-overvalued ]. SCTY designs, finances, and installs solar energy systems (including reselling excess electricity) and builds (or retrofits) charging stations for (you guessed it) electric vehicles!
Since I don’t consider Elon Musk’s huge commitment to the solar industry to be sufficient rationale for you to invest in solar, here are the current reasons that an investment within the industry may be worth considering:
1) There is nothing like a full-fledged “shakeout” to restore equilibrium within an industry!
a) The industry is free of any solar panel “glut”;
b) Excess capacity is a thing of the past;
c) Bloomberg’s Ehren Goossens reports that, for the first time since 2006, there is a supply shortfall:
i) SunPower Corp (SPWR) CEO, Tom Werner, reports: “It would be fair to say our panels are in short supply,”
d) IHS, Inc.’s Stefan de Haan (an analyst) observes that the generally accepted metric for total “production capacity” of 70 gigawatts is quite deceptive!
i) Much of the installed equipped in the industry is older and neither as efficient nor profitable as newer equipment.
ii) Therefore, De Haan estimates that “adjusted” capacity would fall into a range around 59 gigawatts.
2) Demand for solar power installations is projected to grow 29% this year and 18% in 2015.
a) For perspective, consider these metrics regarding installations:
i) In 2009, about 9 gigawatts was installed;
ii) By last year, that had grown to 40 gigawatts of installations;
iii) By the end of 2014, it is estimated that 52 gigawatts will have been installed this year;
iv) There are some experts who project that 61 gigawatts will be installed during 2015… or almost seven times what was installed during 2009.[6]
3) The electric industry’s cost dynamics have changed dramatically!
a) With the per watt cost of solar panel technology now sitting at $0.60, there are many areas around the globe within which solar power can compete (at the wholesale and/or retail level) with older forms of electric generation.
b) More startling is the fact that certain experts are projecting that rooftop solar installations can become competitive with conventional electricity (from “the Grid”) within just three years!
c) Especially for countries like China, with vast regions of territory located far from established urban areas, there are thinly populated (remote) areas within which solar energy will not only be cheaper than conventionally sourced electricity – it may actually become the most (or only) commercially feasible source of power!
4) Just as important as the solar energy industry becoming competitive, and therefore “sustainable” as a business model, is the growing creativity being employed by some of its more visionary leaders.
a) SunEdison Inc. (SUNE) considered its future growth as a major developer/seller of photovoltaic energy “solutions” (including the development, financing, installation, and operation of distributed power plants) burdened by its ownership of a mature semiconductor business.
i) Therefore, it recently spun off its chip business into the now separate SunEdison Semiconductor (SEMI) company![7]
ii) In addition, it engineered an even more creative idea — it spun off a new firm (TerraForm Power Inc. (TERP)[8]) that will buy completed solar projects from SUNE, manage them, and throw off a regular dividend to shareholders (including, of course, SUNE itself!)
b) Through these spinoffs, SUNE has managed to accomplish at least the following:
i) Enables SUNE to focus on the highest growth business segment;
ii) Have a ready buyer for its completed projects so capital is not tied up (enhances cash flow and operating capital);
iii) Receive a little boost to annual income, as well.[9]
So have I convinced you to consider investing in the solar industry?
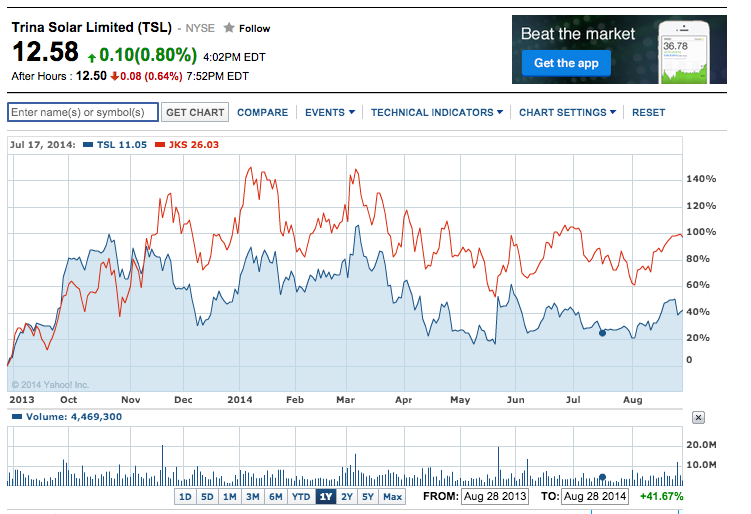
If I have convinced you to seriously consider “going solar”[10], then let me also urge you to avoid investing in any single solar company! Take a look at this:
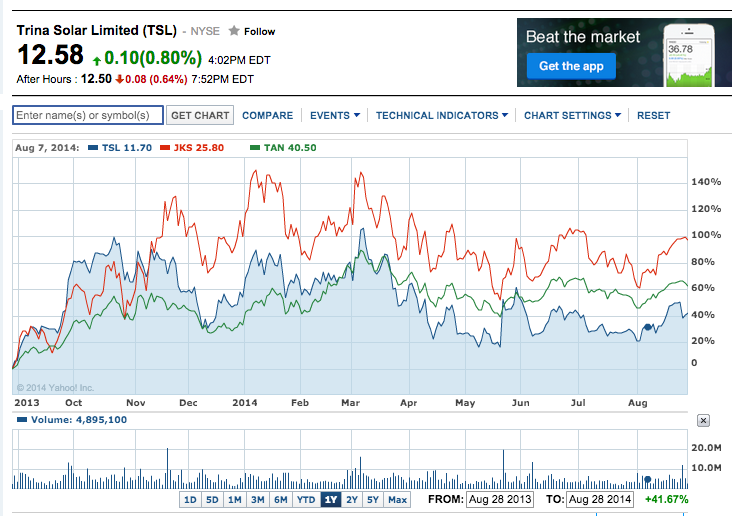
There you have the past 1-year performance of Trina Solar LTD (TSL) and Jinkosolar Holding Co (JKS). If you enjoy the exhilaration of wide, volatile price movements, solar stocks could be perfect for you!
On the other hand, if you value normal blood pressure, sound sleep, and relatively low drawdowns, you might prefer the much less risky and smoother TAN ETF!
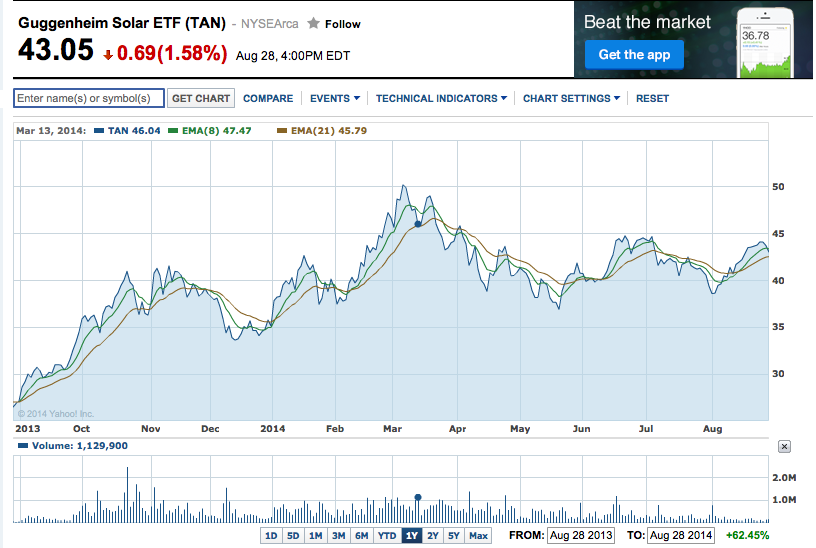
A 61% one-year performance is not too shabby! In fact, for the 2013 trading year, TAN was the best performing non-leveraged ETF!
There are just three more items I want to share with you about TAN, and they are (rather ironically) related:
1) TAN holds some of the most heavily shorted stocks on U.S. exchanges.
a) As an example, SCTY and GT Advanced Technologies (GTAT) recently reported short interest of 29.2% and 34.3%, respectively.
b) Therefore, investors are virtually always on the look out to “borrow” such stocks so they can sell them short!
c) TAN management saw this as the tremendous opportunity, so it engages in a very active securities lending program… for which it receives compensation!!
2) The Wall Street Journal has reported that, during the past three years, TAN has outperformed its own benchmark index (the MAC Global Solar Energy Index) by a median of 3.6 percent a year. (That is quite unusual.)
a) The reason for this outperformance is that extra income stream from securities lending!
b) That healthy supplemental revenue stream has also helped TAN to sport a dividend.
c) The current dividend amounts to just a 1% yield; but at one point in 2013 (at a much lower price) some sites showed it yielding over 5%!
3) During a recent 10-day period (at the ISE, CBOE, and PHLX), TAN itself carried a Put/Call Volume Ratio (P/CR) of 23.31.[11] According to Schaeffer’s Investment Research, that was the highest P/C discrepancy for TAN in about a year.
a) One significant consequence of such a disparity is this – if TAN continues to move higher, those puts (and short sales) would need to be covered, causing a tailwind that would push price higher still!
b) A number of traders consider a high P/CR bullish, because it could indicate excessive bearishness.
i) Reversion to the mean could therefore lead to a move higher, which in turn could result in
ii) Short covering… accelerating the move up.
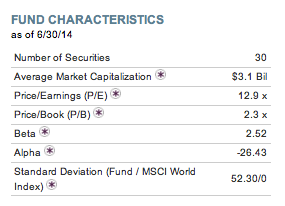
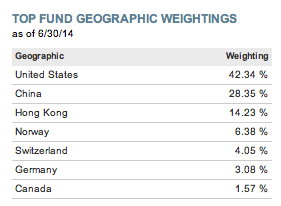
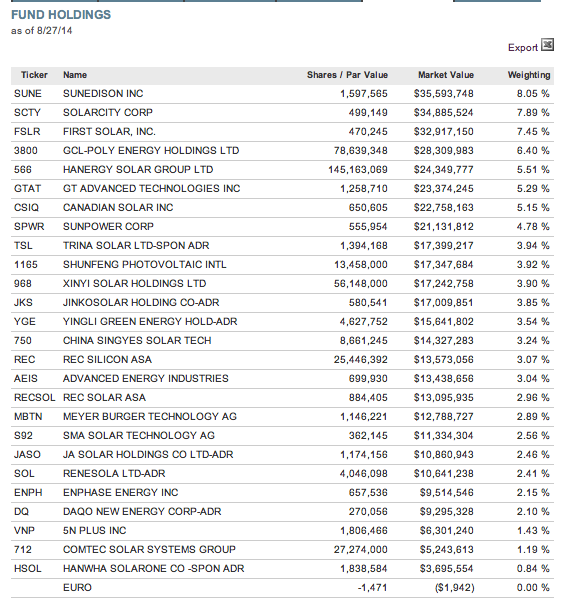
Below are screen shots of key metrics and major holdings/weightings for TAN. Note that the largest holdings within the ETF are SUNE, SCTY, and First Solar (FSLR).
INVESTOR TAKEAWAYS:
Many of you know that there is a second sizeable solar ETF: Market Vectors Solar Energy ETF (KWT). It is a fine ETF. However, it reports less assets under management, lower average daily volume (lower liquidity), and has underperformed TAN on both a YTD and 2-year basis. Therefore, I have focused my narrative on TAN. However, during any given future reporting period, KWT could outperform TAN – so you may want to compare the two ETFs further.
As you can see from this one-year chart, one way to trade TAN is to follow the crossovers of the 8-day and 21-day Exponential Moving Averages. Other worthy strategies would include buying when the ETF moves down toward the lower Bollinger Band, or trading the recent range between $38 and $45/share.
Then of course, credit spreads are always in order, using one of the above strategies as your barometer for when to sell and buy back your spreads.
On a personal level, I find the solar space intriguing. It certainly has a “growthy” edge to it, and I notice more frequent references to solar power within articles regarding mainline electric utilities! However, I do not feel comfortable investing in (or trading) any single solar company stock – that brings with it too much company-specific risk. Therefore, an ETF such as TAN offers a more moderate risk-reward profile!
Here is one other note that will serve as a “heads up”[12] for you:
The “Geographic Weightings” screen above shows a weighting of over 42% in the China region. A heavy China weighting is virtually impossible to avoid in a solar ETF. So why is this a “heads up”?
As I have shared before, Chinese companies have been notorious for less than rigorous accounting methods. In addition, solar developments within China, particularly those related to (or mandated by) Government policy or financial support, pop up in the news on a regular basis – almost always swaying the solar market up or down.
Once again, there is no escaping this reality within the solar space. But one can take some comfort in holding a diversified portfolio of solar companies instead of one specific company stock that could, at any time, fall victim to one of the emerging developments I referred to above!
DISCLOSURE:
The author has traded FSLR and SCTY in the past and has held options and/or shares in TAN on a fairly regular basis for over one year. Nothing in this article is intended as a recommendation to buy or sell anything. Always consult with your financial advisor regarding changes in your portfolio – either subtractions or additions.
FOOTNOTES:
[1] Translation: “Oh, to the contrary my brother (or my sister)! I see the picture perfectly! I have found it!”
[2] Of course, the Financial Crisis took hold in the Fall of 2008… bringing “Risk Off” to the forefront.
[3] For the most part, that is…
[4] The highly profiled collapse of the California firm, Solyndra, propped up through federal loans that were trumpeted by folks from the White House, was just the tip of the iceberg as far as bankruptcies within the solar industry is concerned.
[5] This means that each holder of 10 shares suddenly owned just 1 share. It was not a taxable event, but it is the stock market version of “crying uncle”. It is never a good thing to own a stock that has to execute a reverse split… something these days that occurs most often among leveraged ETFs.
[6] Note that 61 gigawatts exceeds De Haan’s projection of usable capacity mentioned earlier!
[7] Outstanding stock ticker!
[8] That ticker is strangely reminiscent of the name the grade school bully called me!
[9] I have mixed feelings about the ethics of the TERP spinoff… I fear that TERP buyers may eventually be left “holding the bag” if all doesn’t go as planned. But this financial engineering by SUNE is absolutely impressive!
[10] OK, I can’t resist the temptation. The Cubs have “Gone Soler”!! You see, the Chicago Cubs have managed to bring at least a minute amount of “light” (and a LOT of power) to Cubs fans everywhere … even as they sit in the basement of the National League Central Division. The Cubs signed Jorge Soler in 2012… and just brought him up to the big leagues for the first time. In the finest Cubs’ tradition, Soler homered during his first at bat! http://mlb.mlb.com/news/article/mlb/cubs-no-5-prospect-jorge-soler-homers-in-first-major-league-at-bat?ymd=20140827&content_id=91758114&vkey=news_mlb. That is “Soler Power”!!
[11] 23 Puts for every 1 Call!
[12] And/or a “caution”…
Related Posts
Also on Market Tamer…
Follow Us on Facebook



 Tesla Reports Automotive Revenue Down 20%, but the Stock Rises on Positive News

