As we’ve discussed before, financial academicians have thoroughly documented that one’s investment return is predominantly determined by the asset allocation of the portfolio. That axiom is most often referred to as the “efficient frontier” – using a graph to compare the performance of various allocations across time. An example would be to create a chart contrasting an all U.S. equity portfolio (ie. 100% US Equities) with portfolios such as the following:[1]
 Quite a potpourri of allocations, wouldn’t you agree? Of course, there are potential combinations and permutations galore, but I am just a simple man and can only deal with so many variables at a time.
Over a 15-20 year time frame, which of these four portfolios would most likely generate the highest return? In theory, the portfolio with the greatest diversification across asset classes and countries will generate the highest return! Because many of the asset classes are “non-correlated” (ie. some will outperform when others lag behind, until the investment cycle changes and relative performance reverses), the portfolio return is enhanced while portfolio risk is reduced – resulting in what most investment managers strive for: an improved risk-to-reward ratio.[2]
OK, let’s move away from the “boring theory” and move into the interesting stuff! Since we know that choosing the best “countries” within our portfolio can enhance return, is our return maximized if we choose an ETF that invests in a particular we expect may outperform — after all, the ETF is diversified, correct?
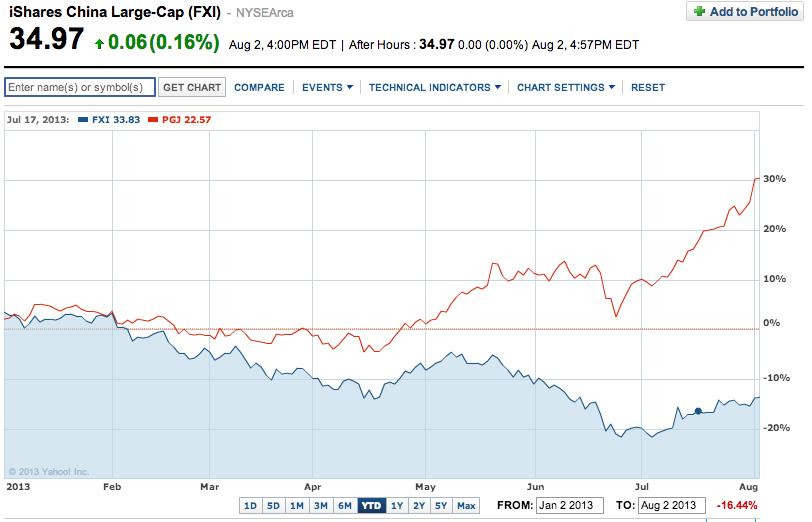
Let’s examine this thesis by studying a graph of two ETFs each investing in China (iShares China Large Cap (FXI) and PowerShares Golden Dragon China Portfolio) (PGJ).
The graph would be understandable if PGJ were an INVERSE ETF, but it is not. Therefore, the year-to-date (YTD) performance chasm between the two ETF’s is flabbergasting, isn’t it: about 42%! If you owned FXI and your best friend owned PGJ, you might wonder which very dark cloud was suddenly hovering over your portfolio! However, “dark clouds” have absolutely nothing to do with this story – it is portfolio composition.
Let’s take a peek “under the hood” of each of these ETFs. FXI has been heavily invested in financials – to the tune of 53%! In fact, a professor of finance at Harvard or Trinity College might well suggest that FXI had become a non-diversified fund due to its outsized weighting in finance. The YTD performance of FXI perfectly illustrates the hidden danger lurking within an ETF that, in truth, has an overwhelming weighting in one industry but does not reveal that in its title (such as iShares China Finance Large Cap Fund). If you’ve been following the news from China this year, you are aware of the “SHIBOR” crisis within the country that broke out this spring and caused a severe liquidity crisis. The financial strain among banks and companies was so severe that some experts suffered nightmare visions resembling our own infamous “Lehman Brothers” crisis.[3] No wonder FXI performance was pathetic!
This next revelation is a bit embarrassing, because I do prefer PGJ’s portfolio when compared with FXI (but only on a relative basis). The embarrassing fact is that PGJ suffers from the same “sin” of non-diversification that has ensnared FXI. The difference is that PGJ is over-weighted in the technology space – to the tune of 52%. Also notable, it has only 1% in financials – thereby insulating itself from the worst repercussions of SHIBOR. However, I cannot emphasize enough that PGJ thereby violates the essential principles of both diversification and the efficient frontier! It’s incredible performance since January 1st has been predicated on its own potentially “fatal flaw” – hitching its wagon (for the most part) to one industry.
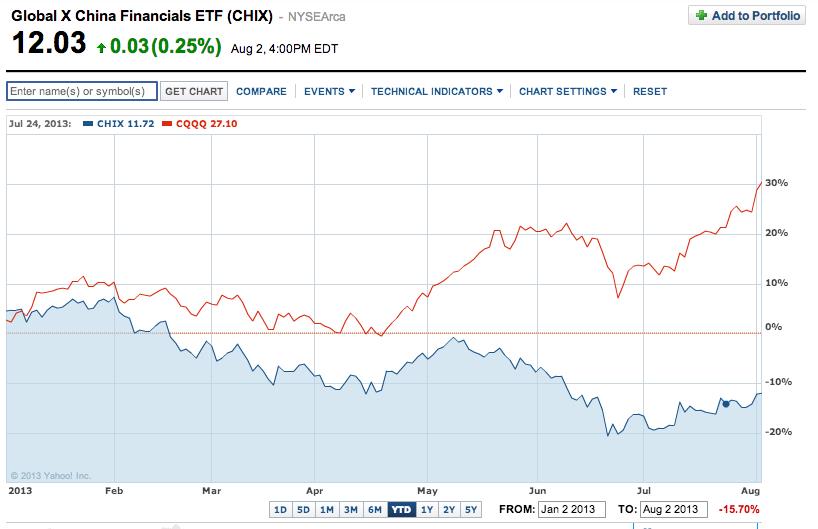
The graph above illustrates another view of the same dynamics that we observed above. On the surface, the obvious difference here is that the “mirror image” in performance is a bit more pronounced from the start of the graph. There is one other notable and laudable difference at work here. The two ETFs I show here are Global X China Financials (CHIX) and Guggenheim China Technology ETF (CQQQ). Do you recognize the huge difference here? These two ETFs engage in “truth in labeling”!!
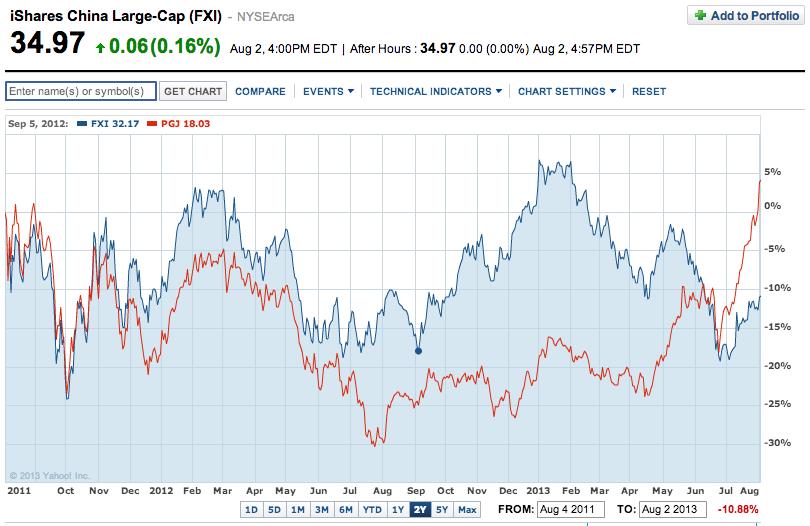
Let’s observe one more important point regarding FXI and PGJ before we wrap up. Here is a two-year graph:
What jumps out at you here?
Absolutely! Through December of 2012, you would have much preferred to be invested in FXI rather than in PGJ! [It goes without saying that, in the big picture, you would rather have invested in the S&P 500 during these two years!]
I considered adding just one more graph of all four ETFs for the two-year period, but nothing new would be gleaned from such a graph that we have not already covered. In a future article, I hope to cover the possibility that China is now a “value play” and touch on the creation of a new ETF that has chosen as its “benchmark” the Chinese “Five Year Plan”. [I think I have now seen everything!]
INVESTOR TAKEAWAY: The takeaways here are extremely simple, but extremely important:
1) Learn more about the “efficient frontier” and how to improve the risk/reward characteristics of your investment portfolio by adopting some of its principles;
2) Never, ever, ever choose an ETF simply because it is positioned in the country that interests you! Always, always, always use one of the financial websites to “look under the hood” at the industry and company composition of that ETF’s portfolio;
3) Never forget that if you ignore the central importance of adequate portfolio diversification – you do so at your own peril – or at least the peril of your portfolio’s performance!
DISCLOSURE: The author has frequently owned Chinese stocks, but currently holds none. He has (in the past) owned FXI, but not since the end of 2012. He has never owned PGJ, CQQQ, or CHIX. Nothing contained above is intended as a recommendation to buy or sell anything. The only recommendation is that you apply the essential elements of diversification and risk management (as well as consult with your financial advisor – it is her/his job to help you maintain balance in your investment plan!).
Submitted by Thomas Petty MBA CFP
[1] I am absolutely not recommending any particular allocation. Each investor must choose the allocation that best fits her/his return expectations and risk profile!
[2] Another way of saying this is — generating each unit of positive portfolio return involves less risk!
[3] Explaining the SHIBOR liquidity crisis is beyond our scope here. Suffice it to say that the central bank was trying very hard to rein in financial excesses, and found itself having gone a bit too far in “shutting off the liquidity spigot.” A lesson to central bankers regarding the dangers of any sort of overbearing governmental tinkering with an economy – especially one as large and unwieldy as China.
Related Posts
Also on Market Tamer…
Follow Us on Facebook


 Is IonQ Stock a Buy?


