Here is an intriguing exercise for you. It is not a “test” or a “quiz”… but a look inside your “trading mind”.
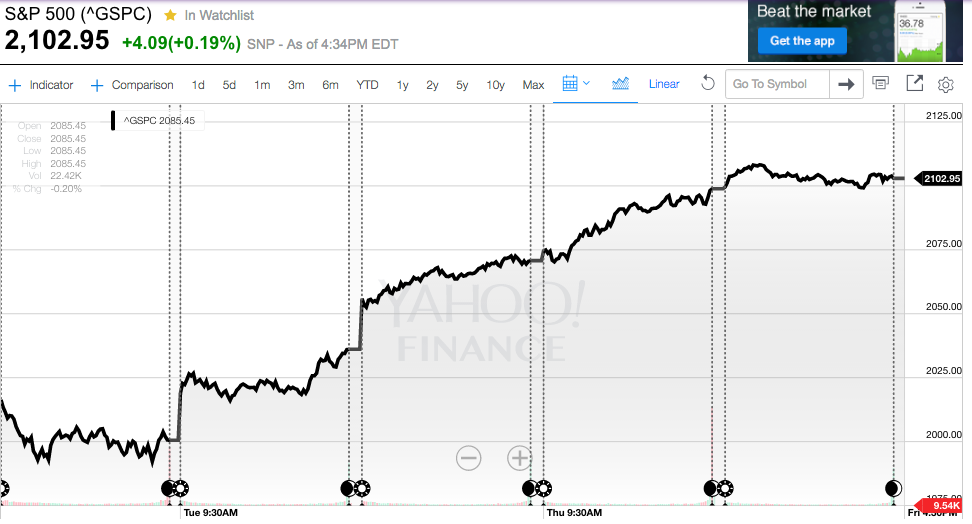
Take a look at the following chart and decide what your mental response would be if, overall, your portfolio was positioned “bullish” when this trading action took place:
I think it is fair to say that, for most of us, we’d be somewhere between “happy” and “ecstatic”! In fact, I dare say that some of us might have been peeking online at our total account balance by the close of trading on that last day, correct?
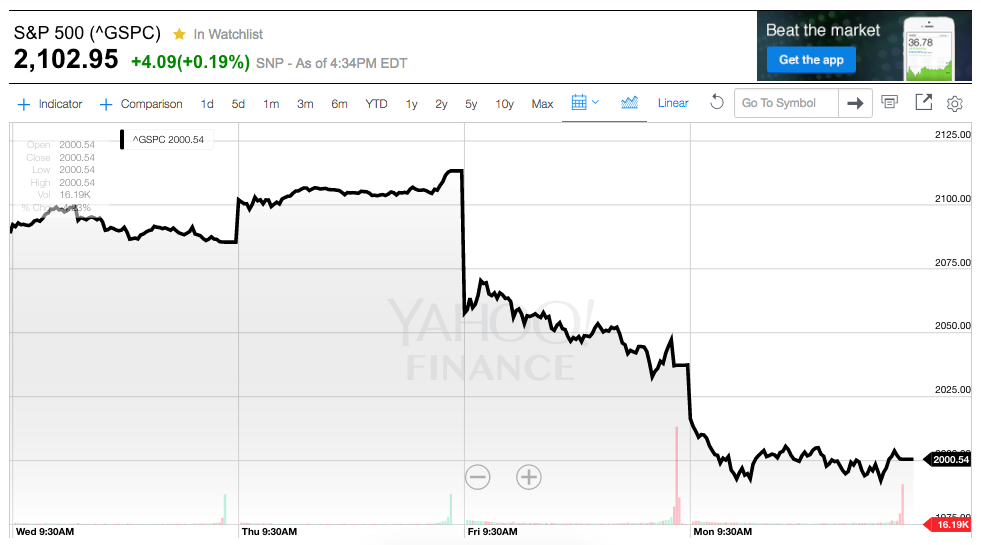
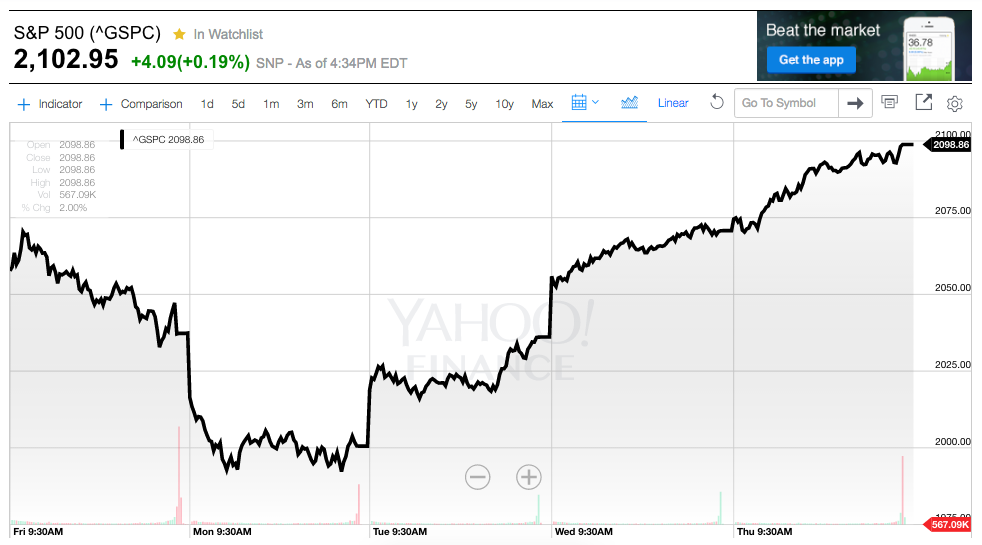
Now take a look at the following chart and decide how you would be feeling in the days that followed the elation you were feeling earlier:
Whoops! Your account balance(s) tumbled by about 5% in just two days!!
What would your initial impulse be? Might it be:
1) To “hold on” as you are positioned;
2) To take some short positions and/or buy puts;
3) To buy some “Inverse” equity ETFs;
4) To sell some calls on stocks you own… and/or sell call spreads to “cushion” your losses if they continue; or
5) To utilize some of your cash reserves to buy more stocks, expecting the market to very soon reverse direction?
Since I know I cannot fool our loyal Market Tamer readers, by now I am confident you have deduced that the above charts depict market action from June 20 through the 23rd… and then market movement throughout the Friday and Monday that followed the announcement of the “BREXIT” vote.
In the interest of transparency, here is an extremely condensed version of what went through my mind:
“Crap… I should have put on more ‘hedges’! What an idiot I was to listen to all those ____[1] slick ‘market experts who so confidently assured everyone that:
‘The Market says the Brexit vote will be in favor of ‘Remain’… not ‘Leave’… and the Market is very, very rarely wrong!”[2] [Some even said: “never wrong.”]
“Now I need to DO something… make some trades to try to recoup what I’ve lost and to protect what is left!”[3]
But then my “other” self rose to the fore[4]:
“What a minute! Are you crazy? Anything you are liable to do out of your need ‘to DO something’ is as likely to be wrong as right!”
“Just take a deep breath, Petty… calm down… and limit your impulses to managing your option positions. There are a few that are now out of balance and skewed way too bullish for the current environment. Just use your energy to decide what to do with those:
1) Roll them out (and up or down);
2) Close them for the current loss (and be happy it isn’t worse);
3) Or add a ratio spread to balance delta and lower your risk moving forward.”
Not surprisingly, I was hardly “alone” in my impulse to “do something” with my portfolio.
Based upon reports from major 401(k) Plan “Record Keepers”[5], Friday morning (June 24th, following announcement of “Brexit” results) witnessed a huge spike in call volume from participants – reflecting the relationship between market volatility and investor fear!
For example, call volume into the 401(k) Fidelity Investments[6] call center spiked over 50% over regular volume for the first hour of the average Friday morning! (U.S. stocks had opened down that morning by 2.6%).
Echoing investor alarm, Voya Financial reported call volume on the 24th that was almost 30% higher than normal, and Empower Retirement witnessed a 24% spike in call volume. Edmund Murphy, who serves as the president of Empower, offered this observation:
“When you get these kind of events, it tends to lead to higher [call] volumes.”
For its part, a spokesperson from Massachusetts Mutual Life Insurance (David Potter) reported that it received twice as many calls on the 24th as they did on the 17th… with most participants asking some form of the question:
“What should I do now that the market is falling so sharply?”
This type of investor reaction to volatile markets is hardly unusual. Recall the downward turn in the equity markets in January and early February of this year. According to Fidelity, on the first day of January trading (1/4) it received almost four million contacts from investors either by phone or online – establishing a new record!
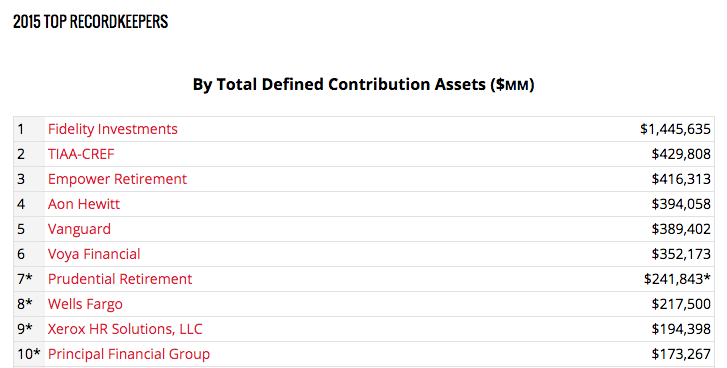
This is a list of the top ten “Plan Record Keepers”. Note that Fidelity manages over three times the Plan assets as #2 TIAA-CREF.
A Boston financial research firm, Dalbar, has been doing an amazing job gathering data on investor behavior for decades. Earlier this year it issued its twenty-second annual edition of its analysis of investor behavior:
“2016 Quantitative Analysis of Investor Behavior”[7]
This report is a virtual goldmine of interesting statistics about the actual performance of the “average” investor’s fund portfolio. As you move through the study and the rest of this article, I strongly urge you to heed this simple advice:
Do not let your self get bogged down by the data. Instead, absorb the “big picture”.
I regret to say that the “big picture” is that investors consistently “shoot themselves in the foot” when it comes to their buy/sell decision-making. As Dalbar’s statistics demonstrate, the average investor falls very short of “maximizing investment return”!
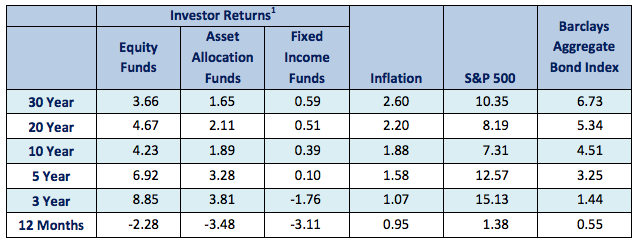
Dalbar’s detailed analysis of returns during the past twenty years (through 12/31/15) is a perfect illustration. If she/he had held the average U.S. equity fund over that period, a solid annualized return exceeding 8% would have been realized. And, of course, keep in mind that this 20 year period includes two of the worst equity “crashes” ever[8]!
| RELATIVE RETURN | Ave. Annualized Gain/Loss: 1/1/95 thru 12/31/15 |
| Simple Buy & Hold Equity Fund | 8.19% |
| Average Investor in Equity Funds | 4.67% |
| Difference | 3.52% |
However, the buy and sell decisions made by the average investor during this period resulted in UNDER-performance (vis-à-vis fund 20 year averages) of 43%! (ie. 3.52% divided by 8.19% equals 42.9%).
Dalbar identifies this as the biggest reason for investor underperformance:
Folks yank their money out of the market after a significant loss!
In fact, Dalbar has even calculated the “cost” of panic selling. It accounts for 44% of the difference between “average fund return” and “average investor return”.
Although dysfunctional with regard to investment return (as demonstrated by Dalbar), this is quite understandable. Humans are “hardwired” to respond to fear – often by “taking flight”. [9]
The 38% free fall investors experienced in 2008 was certainly harrowing enough to prompt deep and wide-ranging fear among investors of all sizes. No one I knew back then could confidently declare when the carnage was going to stop!
Nor for that matter did anyone I know predict the amazing market gain of 30% in 2014!
This very uncertainty is what “costs” the average investor with regard to diminished return. Fear makes them sell on the way down during a steep drop… and also restrains them from buying as the market heads back upward, because of their lack of confidence. According to the Dalbar study, this hesitation by investors to invest their cash after the market has hit a bottom (such as in March of 2008) accounts for another 15% of the underperformance experienced by the average investor. By hesitating, such investors miss significant upside return.
Now combine the result of acting upon fear (and its cousin – lack of confidence) with one of the fundamental teaching points annually reiterated by investment giant, Warren Buffett (CEO of Berkshire Hathaway (BRK.B)) in his “Annual Letter to Shareholders”…
Over the past 89 years of equity market history, there have been more up years than down years![10]
The bottom line result is that the decision-making of the average investor has her/him “selling as the markets are headed to new lows … and buying when the markets have already recouped much of its losses!”
We all know that the most elemental mantra of good investing is: “Buy low and Sell high.” So it is obvious “why” the average investor underperforms the average equity fund return by 43%.
All of this being said, it may be of at least some comfort to “Joe and Sally Investor” that the average fund manager and average hedge fund manager is not much more successful at “timing” the market. That is why so many investment geniuses (such as Buffett) suggest that it is more effective to just buy an index fund (or ETF) and hold it (as a part of a well diversified portfolio) than to ever try “timing” decisions to buy or to sell!
One industry expert who commented publicly about the Dalbar study (Jason Hsu, chairman and CEO of Rayliant Global Advisors) added an additional reason for investor underperformance: performance chasing. Here is important background that will lead up to Hsu's insight:
A truth that savvy market veterans soon discover is that there is no investment “Holy Grail”. Each investment strategy that is successful moves through cycles of peak performance … alternating (to one degree or another) with subpar performance.
However, investors easily become entranced by stories they hear[11] about a manager who has achieved eye-popping returns over the past one, two, or three year period. So investors “pile into” that fund… only to soon find that the strategy then moves into a period of underperformance.
Now here is Mr. Hsu's insightful observation:
“all evidence points to the qualitative conclusion that investors have eroded substantial returns from their tendency to chase past manager success. The return erosion from this trend-chasing behavior appears to be larger than any reasonable manager alpha that could be captured [going forward].”
As we study the Dalbar report and become discouraged by our investment acumen, we might hold on to the hope that we do much better at investing in the Fixed Income space!
We’d be dead wrong!
| RELATIVE RETURN | Ave. Annualized Gain/Loss: 1/1/95 thru 12/31/15 |
| Barclays Aggregate Bond Index | 5.34% |
| Average Investor in Bond Funds | 0.51% |
| Difference | 4.83% |
That works out to a 90% underperformance vis-à-vis the Aggregate Index (4.83/5.34=90.4%).
That is a staggering difference. In this instance, however, Dalbar reports that poor decision-making by investors is not the sole major cause for that abysmal relative performance. Annual fund fees charged against investor accounts exert a much larger impact upon investment return within a bond fund than they do within an equity fund. The reason is simple: over time, average equity returns are much higher than those for bond funds, therefore fund expense relative to return is higher! Dalbar calculates that “fees” account for 22% of investor underperformance within bond funds!
Here is a detailed chart from Dalbar that summarizes their results from three different types of funds… and over multiple time periods:
 There is one particular expert’s reaction to the Dalbar study that I found to be particularly insightful and (simultaneously) extremely amusing. Robert Prechter[12] is the executive director of the Socionomics Institute. The institute studies social “mood” and its impact upon social action – including within the economy and the stock market. Prechter does not disagree with the essential Dalbar thesis that the average investor underperforms “the Market”. The data is overwhelming in that regard. Prechter’s critique regards what one might be able to “do” in response to the study’s findings.
In Prechter’s opinion, trying to “educate” folks out of their natural (counter productive) investment patterns is a very daunting (and perhaps impossible) task:
“These are mostly old canards, and none of them can work, because investors’ hope, fear and herd [mentality], and no blackboard lesson can change that behavior. [Advice that tries to] focus on the long term really means buy and hold, which looks good in retrospect but is a bad idea at certain times in history.”
Then Prechter adds the piece de resistance [or the crème de la crème]:
“Telling investors to avoid doing what they have always done is like advising fish to stop schooling.
[It is like] ‘Become inhuman, and you will be fine.’
It’s true, but the advice is not exactly easy to follow.”
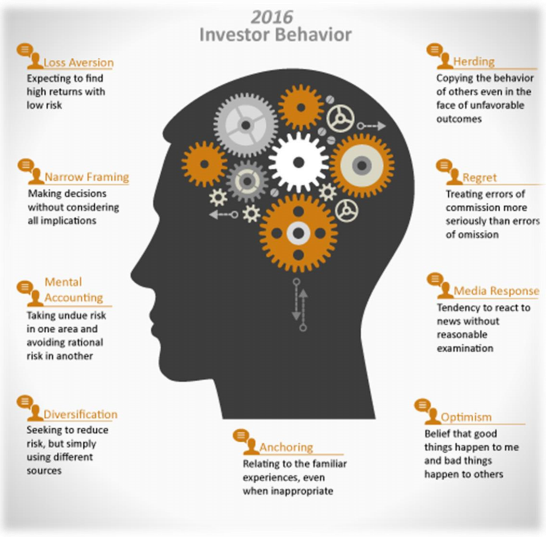
The human factors that impact investment decision-making are numerous and complex. That is what makes the growing area of Financial Behavior Studies so appealing and stimulating. This chart illustrates a few of the more commonly identified factors:
I am confident that each of us can identify at least a few of these factors that impact our own investment decision-making.
Building upon and expanding the topics explored by the Dalbar study, data released by Morningstar at its huge mid-June Conference in Chicago can potentially serve as a source of helpful insights and guidance for investors as they make future investment decisions
Russel Kinnel is the director of manager research for Morningstar. Commenting upon Morningstar’s own 10-year study of investor return, Kinnel echoed the essential point established by Dalbar:
“Investors tend to buy high and sell low, missing out on a fund’s gains in value.”
Much of the content of his study (and the Conference) reiterates that the natural human inclination is to buy after a fund has gained value and to sell after a fund has lost value… thereby depriving the investor of much of that fund’s ongoing return stream.
Kinnel goes even further than this in his commentary… emphasizing that poor decision-making has a compounding impact upon return over time:
“Our investor returns data has shown that investing decisions made a decade ago have an impact that compounds powerfully over time. Though investor return figures have somewhat improved year over year, the latest data shows that investors still face challenges in using mutual funds correctly.”
Morningstar’s study of open-end mutual funds analyzed the average asset-weighted investor returns vis-a-vis the average fund returns. Even more interesting, it also tested for the impact of four factors on investor returns. I will describe all four factors, and then offer further detail regarding Morningstar’s findings on two of these factors.
1) Standard Deviation:
Perhaps the most commonly understood use of this factor in mutual fund management is the advent of “Low Volatility” funds.
2) Tracking Error:
“Tracking Error” refers to the extent to which a fund’s returns deviate from its benchmark.
3) Expense Ratios:
This factor is perhaps the most easily identified by investors, since each fund is required to publish its annual Expense Ratio – which discloses the size of the annual fee(s) it charges investors.
4) The Morningstar Stewardship Grade:
This “Stewardship Grade” assesses funds based upon the degree to which they are “shareholder friendly” … with particular focus upon the fund’s management and governance polices.[13]
Let’s look more closely at “Standard Deviation” and “Expense Ratios”:
Standard Deviation:
Morningstar categorized funds in its study by relative volatility and found that investors in lower volatility funds fared better than those in higher volatility funds.
As Alex Bryan of Morningstar has observed: a lot of academic studies have been published that show that stocks with low volatility have historically offered a better risk/reward trade-off than the overall market. So Low Volatility is a factor that is accretive to an investor’s relative return.
Expense Ratios:
This factor is perhaps the most easily identified by investors, since each fund is required to publish its annual Expense Ratio – which discloses the size of the annual fee(s) it charges investors.
For many years, Morningstar has recognized that expense ratios are a key factor in determining net investor return. This 10-year study confirmed Morningstar’s long-held assumption.
Funds with lower expense ratios exhibited smaller gaps between average investor return and the average return of “all funds” than those experienced by investors in relatively higher-cost funds. In other words, fund’s with lower expenses show a significant boost in relative return!
Let’s take a deeper look at the “Expense Ratio” factor.
Kinnel has authored a whitepaper entitled “Predictive Power of Fees: Why Mutual Fund Fees Are So Important.” According to Kinnel’s analysis, expense ratios are the most effective predictor of investment performance.
For that study, Morningstar divided funds within each of its categories into quintiles based on their expense ratios, then compared the quintiles' performance over a five-year period ending in December 2015.
Within the analysis, Morningstar used the term “Success Ratio” – which measures the percentage of funds whose total return outperformed its category group.[14]
| SUCCESS RATIOS | Lowest Expense Ratio | Highest Expense Ratio |
| U.S. Equity Funds | 62% | 20% |
| Taxable Bond Funds | 59% | 16% |
| International Funds | 51% | 21% |
As we can see in the table, the contrast in relative performance based upon expense ratios is startling and compelling… within all fund categories.
INVESTOR TAKEAWAY:
The detailed studies by Dalbar and Morningstar can leave no doubt in anyone’s mind that investors consistently underperform “the Market”… no matter which market one looks at.
In that sense, Buffett’s recommendation to the Trustee of his assets upon his death (for management of assets on behalf of his surviving spouse) makes sense:
“My advice to the trustee could not be more simple: Put 10% of the cash in short-term government bonds and 90% in a very low-cost S&P 500 index fund. (I suggest Vanguard’s.) I believe the trust’s long-term results from this policy will be superior to those attained by most investors – whether pension funds, institutions or individuals – who employ high-fee managers.”
However, as Prechter has so insightfully pointed out, that advice is quite difficult to follow in the face of a market that is cascading downward like an avalanche (such as it did in the 2000-2002 and 2007-09 periods). After all, we are not just risk averse… we are loss averse, and loss averse in spades!
No wonder Retirement Plan Managers (such as Fidelity) had their phones ringing off the hook in the days following the “BREXIT” vote! We are hard-wired with a strong fear instinct whenever we face danger – not just immediate danger (such as a gun to our head) but also more distant, abstract fear such as a falling market!
That is why I was “struggling within my own self” on the 24th and 27th of June. My instincts were pushing me to “do” something… “save my portfolio”… “stem the losses”… etc. But my analytical self[15] kept reminding me:
“What a minute, Bozo! Do not rush into anything. In this fast moving market, you are as likely to make matters worse as you are to make them better. You have a longer range investment plan,,, you have ‘rules’… you have diversification. So depend upon them and do not try to mimic ‘Superman’… rushing in to ‘save the day’!! You are not invincible, you are not invulnerable, and you certainly cannot fly!”
So who won that internal struggle? Thank goodness it was the analytical side! Other than performing damage control in the account I use for option trading[16], I stood aside and let the market do what it does – it moves.
As the week after “BREXIT” proceeded, that was an excellent decision (as you see above)..
Based on the fact that the S&P 500 had rarely before experienced 3 consecutive days of 20+ point upward moves, I could never have imagined that the market could recover so quickly. If I had succumbed to the urges of my fear instinct, I almost certainly would have either made my losses worse (as the market moved down) or (slightly different… but with the same net result) reduced the profits I regained as the market moved back up.
Given the above, what could investors glean as helpful lessons from the two weeks that surrounded the “BREXIT” vote … in combination with the Dalbar and Morningstar studies? I suggest the following:
1) Do not make investment decisions based upon market volatility (such as that caused by “BREXIT”).
a) Dalbar and Morningstar both teach us that human decision making regarding market timing is extremely poor, and therefore dysfunctional.
b) Over longer periods of time, the Market has proven resilient… as Mr. Buffett regularly assures us.
2) Therefore, adopt an Investment Plan based upon proven investment principles and stick with it through thick and thin.
a) Have an overall plan for your portfolio as a whole. Ensure that it is:
i) Well-Diversified
ii) Balanced in its Allocation of Assets.
b) If you choose to add Active Trading within the above overall plan, then choose a Trading Mentor that offers solid education, a good track record, and integrity!
i) A vital part of “Integrity” within a Mentor is that he/she will never promise to lead investors to huge, quick gains;
ii) Another part of Mentor “Integrity” is admitting that she/he does not know with certainty what the market will do in the next few days… because no one is omniscient.
3) As a corollary to 2) above, resist with all your willpower the psychological need humans have for “certainty”. Giving in to that need will only lead you toward disappointment and (likely) loss.
a) Countless psychological studies have demonstrated that human beings gravitate toward those who offer a “clear, appealing forecast” … and who forecast with great confidence. In fact, that is why our financial media absolutely fill their broadcast day with articulate women and men who offer bold forecasts… with utter confidence. Such guests serve to increase their ratings and network profits.
b) However, someone who offers an appealing forecast with overwhelming confidence is as often as not a far cry from someone who offers an accurate forecast that will prove profitable to act upon.
c) There is a good reason that the term “Con Man” (meaning someone who swindles other people) is derived from “Confidence Man”.
d) Remember this the next time you hear an “expert” holding forth on TV:
The more confident someone sounds when offering a market forecast, the more you should question/doubt what it is he/she is saying.
4) As difficult as investing is, there are some basic “tools” and/or “truths” that an investor can depend upon to increase their profitability.
a) As Morningstar demonstrates, “Expense Ratio” is a powerful factor that can tip the scales of “success or failure” in favor of “success”. At the very least, it is a great boon to an investor’s relative performance.
b) Morningstar also suggests that “Low Volatility” funds offer a better “Reward/Risk” ratio for investors.
c) Avoid making investment decisions (and trading decisions) based upon emotion. The odds are strong that such decisions will prove to reduce rather than enhance your net return.
Hopefully, we are not (as Prechter’s analogy of “school of fishes” suggests) doomed to poor investment decision-making. In my opinion, these steps are central:
1) Focus upon realistic expectations;
2) Adopt a solid, proven Investment Plan … and if you do not yet have one, then choose a trusted investment educator from whom you can learn, grow, and develop such a Plan;
3) Stick with that Plan… no matter what CNBC is presenting any given day as the latest crisis or the hottest investment idea!
If we follow through on the above, we will be certain to enjoy better risk-adjusted returns than if we allow ourselves be driven by either fear or greed!
DISCLOSURE:
The author pleads guilty to occasionally watching CNBC or Fox Business, or listening to Bloomberg Radio. But he regularly reminds himself to “listen” only to the facts presented therein… rather than all the bluster, blather, bother, and baloney! Nothing in this article is intended as a recommendation to buy or sell anything. Always consult with your financial advisor regarding changes in your portfolio – either subtractions or additions.
FOOTNOTES:
[1] Expletive deleted. Gotta keep “El Editor” happy!
[2] There was one particular such “expert” on CNBC before the close on the June 23rd who was extremely smugly saying just that. Even though I wanted him to be right (in fact, I felt great relief at his assurance) one thought jumped to mind immediately: “Geez, I hope that guy is wrong… just to remind him (and all his equally smug colleagues) that they are not omniscient… and will never be omniscient! Therefore, they had better drop that perpetually smug attitude and realize that, at heart, they are no better or wiser than the rest of us!”
[3] That reaction is often referred to as “Revenge Trading”… or more academically, can be considered part of “Mental Accounting”… something you will see on a later chart.
[4] Most Baby Boomers will remember “Jiminy Cricket”… a Walt Disney character who started as the “conscience” of Pinocchio… but became a symbol of anyone’s conscience, common sense, or “more thoughtful self”. I frequently “dialogue with myself in ways similar to Jiminy and Pinocchio.
[5] A “Record Keeper” is hired to keep track of the cash inflows, outflows, and employee loans from any given tax-qualified plan. They also keep the plan participants’ investment plan accounting records and are responsible for either: a) sending the participants periodic reports of their 401(k) assets, or b) forwarding the reports to the employer for mailing to the participants. In addition, a “Record Keeper” manages requisite “Compliance Analysis”, to ensure that the Plan is operating within Federal regulatory guidelines.
[6] Fidelity is (by far) the largest Plan Record Keeper:
[7] http://www.northstarfinancial.com/files/6314/6523/9571/2016_DALBAR_Advisor_Edition.pdf
[8] The “Dot.com Crash” and the “Mortgage Crisis Crash”
[9] Dalbar CEO, Lou Harvey, addressed the need for financial professionals to more effectively communicate with investors and their actual existential emotion… which is decidedly loss averse: “From an industry perspective, language we use and look at is in terms of risk, like market risk, credit risk, volatility risk. We’ve found investors have a simple view: they don’t want to lose money. We must think in terms of investor pocketbook and not get sidetracked on [risks].” Simply put, investors are not risk averse… they are loss averse.
[10] Backing up Buffett are the following facts from AAII: [Looking at Large Cap U.S. Stocks] Between price appreciation and dividends, they returned 7.3% on an annualized basis between 2006 and 2015. This return encompasses the worst financial crisis and economic downturn we’ve experienced since the Great Depression, Greece nearly being kicked out of the EU, Middle Eastern governments being overthrown along with civil unrest in neighboring countries, terrorist attacks, Ebola outbreak and aggravatingly slow economic growth.
Taking an even longer view (ie. since 1926) … Large-cap stocks have risen during 95% of all 10-year periods since 1926.
[11] Often on Bloomberg TV. CNBC, or Fox Business.
[12] Yes, the same Robert Prechter who is famed for “The Elliott Wave Theorist”
[13] Morningstar reports that Funds with a stewardship grade of “A” saw investor returns beat the funds’ total returns by 0.18 percent annually for the decade ending Dec. 31, 2015, while investor returns for funds with an “F” grade lagged total returns by 2.59 percent. To discover which funds are graded “A” and which are “F”, of course, you need to become a Morningstar subscriber.
[14] If you are into such studies, you will want to know that Morningstar factored in the number of funds that were merged away or liquidated over each time period. Morningstar wanted to ensure that only those funds that both survived and outperformed counted towards that quintile's success ratio
[15] Jiminy Cricket, if you will.
[16] Everyone who trades options and regularly carries credit spreads (or even the occasional naked put) knows how leveraged option trading is… which makes it distinctly different with regard to how one handles a volatile market.
Related Posts
Also on Market Tamer…
Follow Us on Facebook






 Is IonQ Stock a Buy?


