Here is a stock story that is appealing on multiple levels:
1) It is in the equity sector (Energy) which year-to-date has outperformed all other sectors, except Utilities [per the SPDR Sector ETFs] providing a return of 6.55% through the end of April;
2) The stock that was beaten down in 2012 due to a drastic fall in natural gas prices, which severely impacted this Canadian-based oil/gas production company and prompted a steep cut in the annual dividend;
3) Based upon the exceptional earnings report turned in at the end of April by Norway-based Statoil (STO), which reflected the huge impact on earnings of a substantial increase in the U.S. price of natural gas (a “double”), the report from this company on May 9th could be (at worst) entertaining).
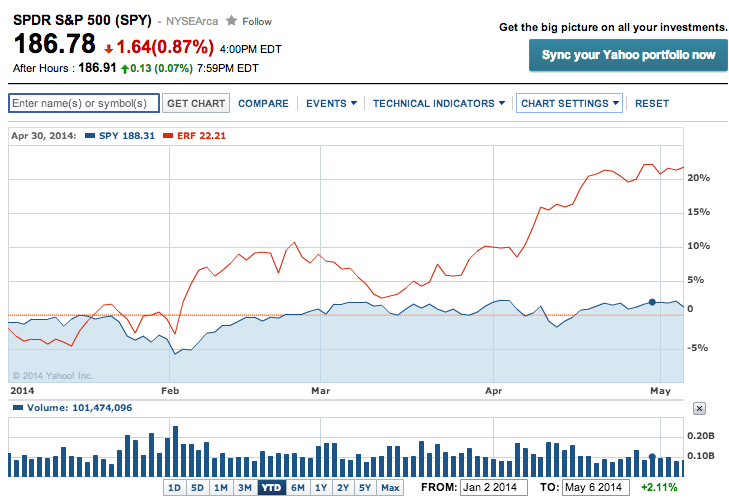
Of course, by now all the diehard oil/gas traders among you have identified our spotlighted stock as that of Enerplus Corporation (ERF). In a market that has been particularly challenging since January 1st, ERF has performed steadily and impressively [S&P 500 Index just above “flat”; ERF up over 20%]:
 What are the essential points in the ERF story?
Free market forces conspired to make 2012 a “nightmare year” for ERF! Take a look at these prices between January 10 of 2011 ($32.93) and May 6 of 2014:
|
DATE |
PRICE |
CHG |
|
1/10/11 |
$32.93 |
|
|
1/2/12 |
$25.48 |
-22.62% |
|
11/12/12 |
$11.80 |
-53.69% |
|
4/15/13 |
$12.87 |
9.07% |
|
5/6/14 |
$22.14 |
72.03% |
It is bad enough that the stock fell by over 22% between 1/10/11 and 1/2/12. Making matters considerably worse, the deleterious effects of a high CAPEX expense during a year within which natural gas prices collapsed worked to crush the ability of ERF to maintain its monthly dividend payouts at the existing level (cut in half). The impact of these developments upon the stock price, can be seen by the almost 54% drop in price between January and November!
However, management reassessed its strategy in light of evolving market dynamics and spent 2013 making significant adjustments. The result can be summarized as follows:
1) Reallocated resources: sold assets projected to be underperforming; bought assets which were identified as likely to be productive and profitable;
2) Reduced long-term debt;
3) Increased FFO (funds for operations);
4) Increased FCF (free cash flow);
5) Significantly increased coverage of the (current) $.09 (CDN)/month dividend;
One of the most powerful decisions taken by ERF management has been a significant adjustment in company assets. ERF’s asset base has (historically) been predominately located in Canada (55%/45% split in 2012). The asset-base went through a significant shift during 2013:
a) ERF replaced almost 240% of its assets;
b) ERF added about 30% in crude oil reserves;
c) ERF increased “Proved plus Probable” reserves by over 18%.
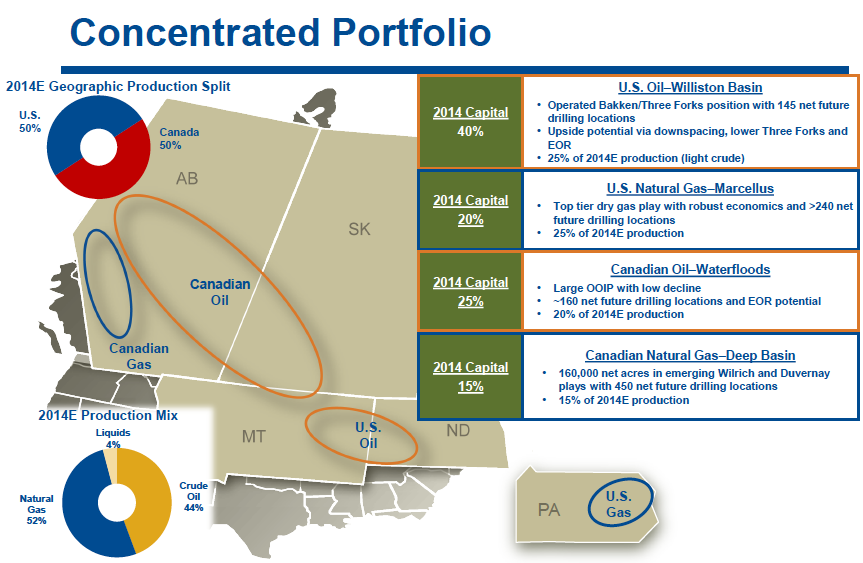
The result has been a more balanced portfolio of assets, including an approximate 50%/50% balance between U.S. assets (including Marcelles, Bakken) and Canadian assets.
Any company that carries a large load of debt receives a benefit from the reduction of that debt. During 2013, ERF worked its debt load down from $962 million to $880 million (a decrease of over 8.5%).
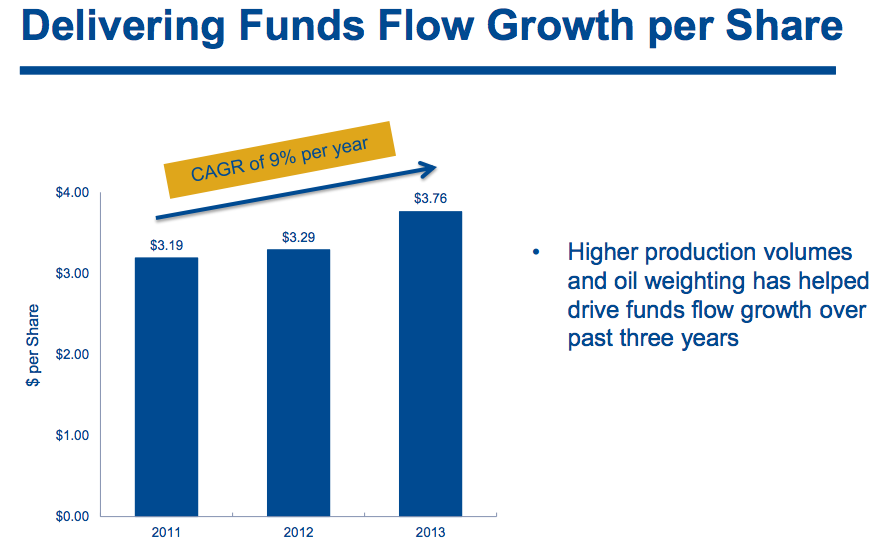
Below are two charts that demonstrate significant increases in “Funds Flow” growth (approximately 17%). [NOTE: the second chart also demonstrates a 17% growth in asset reserves!].
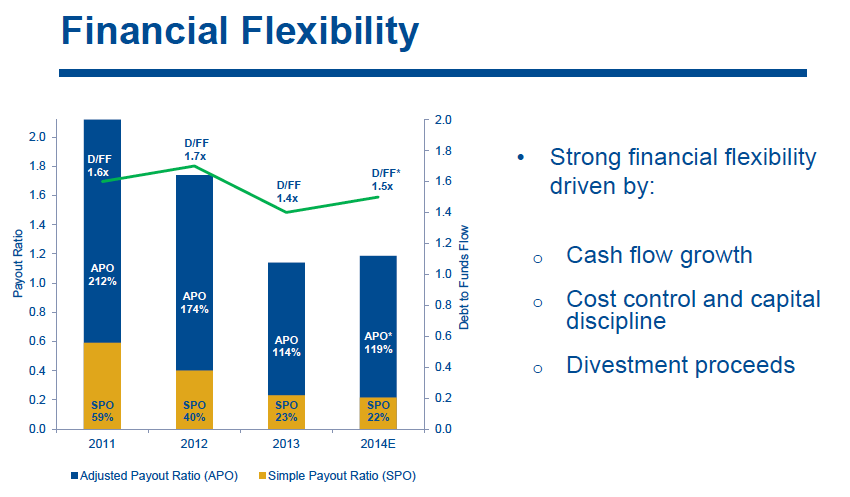
Obviously, as “Funds Flow” increases and long-term debt decreases (accompanied by improvements in measures of efficiency with regard to bringing assets to market)[1], “Free Cash Flow” improves. Very significantly, as all of these trends develop, the financial cataclysm experienced by ERF in 2012 becomes steadily reversed. The graph below demonstrates an improvement in the Adjusted Payout Ratio of almost 50% between 2011 and 2013!
Let’s flesh out the earnings estimate analysis referred to earlier – based upon pricing trends revealed at the end of April in the STO earnings report.[2] Given the significant YTD increases in pricing for both U.S. and Canadian gas and oil, the ERF report to be released on May 9th could show earnings as high as $0.238/share. In sharp contrast, the current analyst earnings estimate is just $0.18/share. If the number actually reported reflects anywhere near the figure projected based on the trends seen in the STO report, the ERF stock price could experience a positive bump up in price.
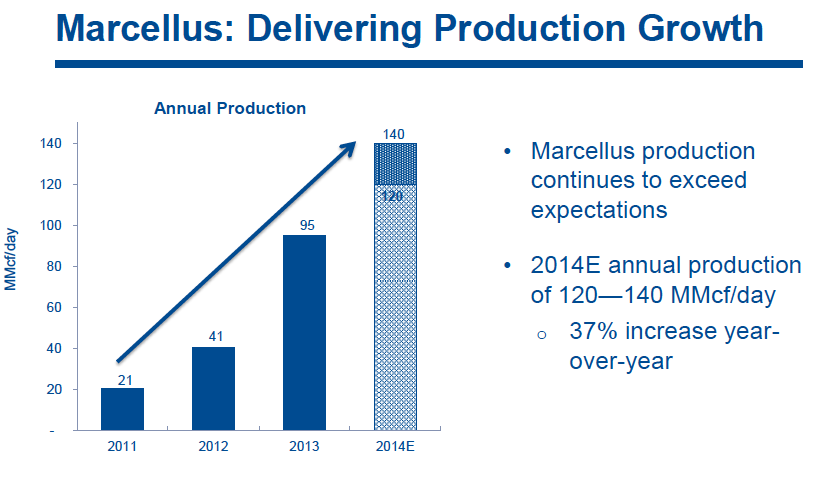
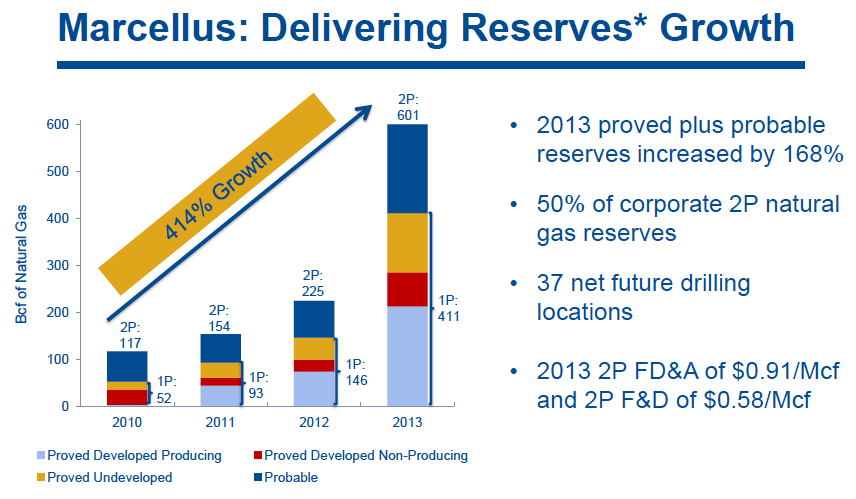
Beyond the horizon of the next few days, the ERF “story” may have “legs” because management seems to be taking appropriate steps to ensure that ERF profits from the explosion in North American energy assets that will continue for years to come. As we hinted at earlier, asset management is the most important responsibility for any energy exploration/production company. In light of that take a quick look at the trends illustrated below:
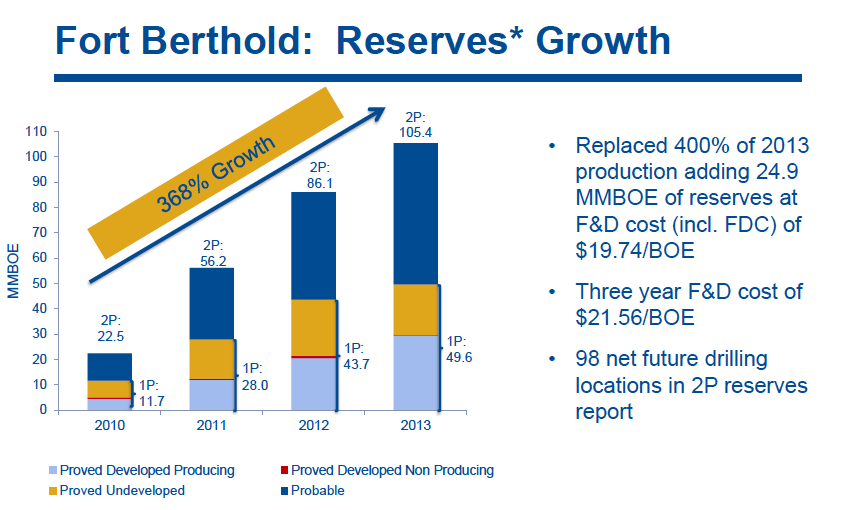
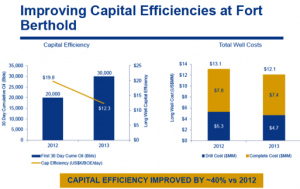
ERF assets in North Dakota reflect similar trends and production/profits in Canada continue to improve. So overall, the development and growth of ERF assets appears to be set upon an encouraging course for the years ahead. Just savor the prospects suggested by this graph (Fort Berthold is a North Dakota asset):
A significant trend with regard to ERF assets is hinted at by this graph regarding the available inventory of natural gas in underground storage:
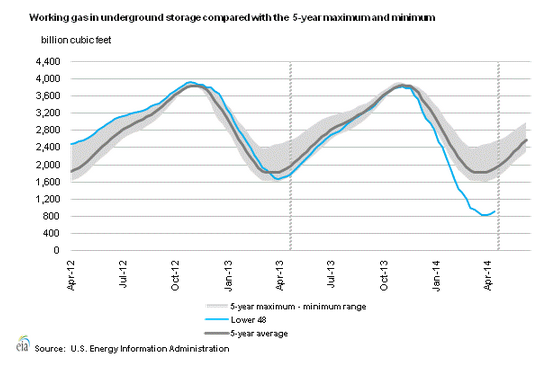
Natural Gas in "storage" is at a low in the cycle, suggesting that prices have room to rise further!
This chart suggests that natural gas prices could have substantial room to move higher. The standard counterpoint to such a chart is that, given the abundant supply of gas underground, any gap between demand and supply can be bridged quickly through added production. However, as experts point out, the big companies with gas assets (such as Exxon-Mobil (XOM) and Conoco-Philips (COP)) will only add production at an appealing price – ie. a price significantly higher than the current price.
An additional plus for U.S. investors in ERF is a significant change in the company’s dividend reinvestment program (DRIP). Formerly, U.S. investors did not qualify for the DRIP. Worse, any cash dividends received by a U.S. investor required tax withholding by the Canadian government – which meant extra effort at tax time to recover said withholding (through a tax credit or deduction). Now, under the new “Stock Dividend Program”, U.S. investors can receive the dividend in the form of additional shares at no cost and without withholding! And in case you missed it earlier, ERF distributes dividends on a monthly basis (appealing for those who prefer steady cash flow).
INVESTOR TAKE AWAY:
Regular readers know that I do not make trading or investment recommendations. However, for those who find the energy space interesting – and, in particular, smaller cap players in the natural gas/oil energy space – ERF could be appealing because management seems to have turned operations around from the disastrous 2012 year and the “growth story” is intriguing.
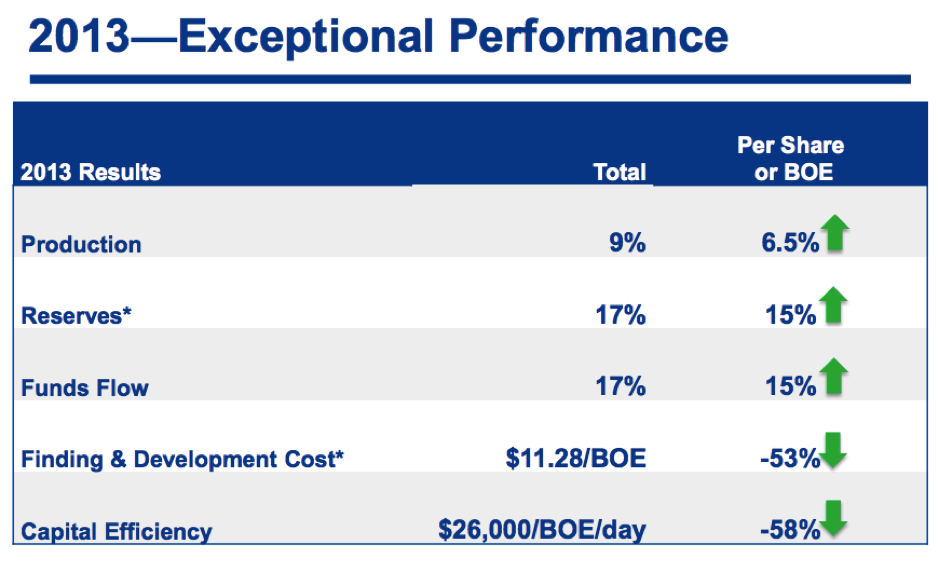
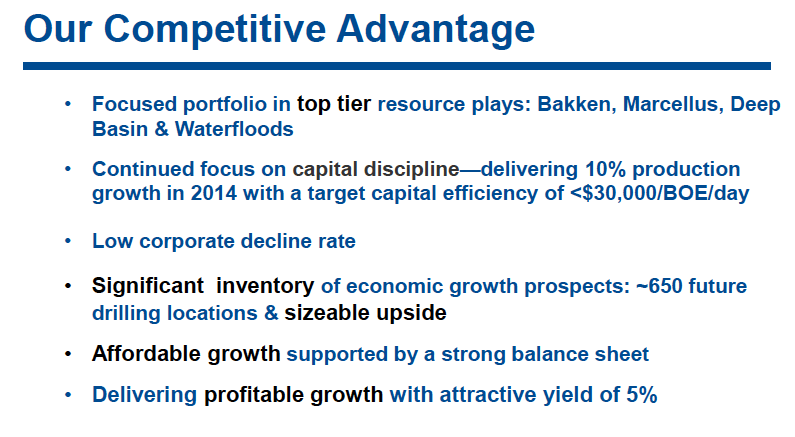
A slide from a February presentation by management summarizes its “case” to investors:
At the very least, the company is operating at the very heart of the North American energy boom, and watching it move forward from here will be interesting!
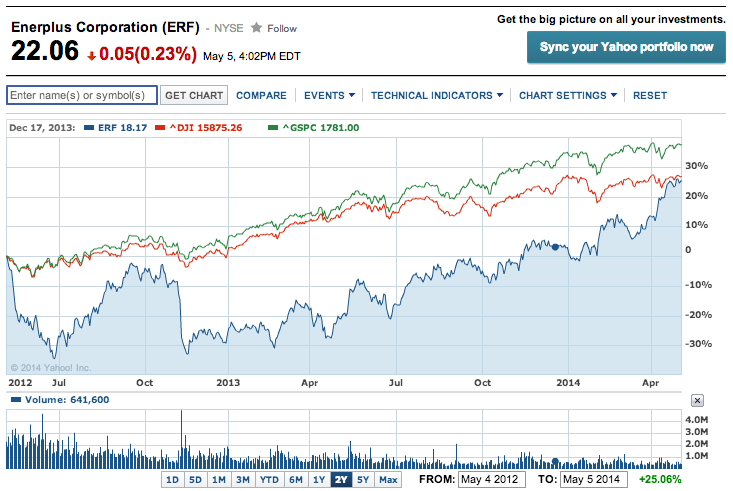
Let’s take a look at some charts. This two-year chart shows that ERF is just now “catching up” with the S&P 500 and Dow Jones Industrials Indices following the disasters of 2012.
However, that means that ERF has demonstrated considerable relative strength during the past year!
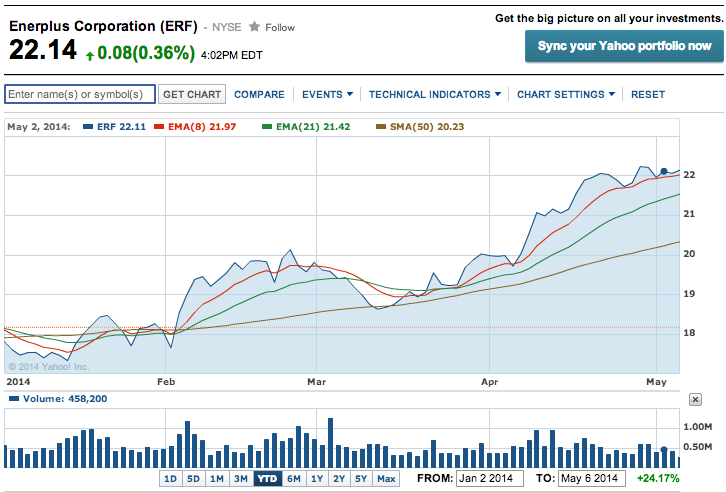
Currently, ERF is sitting approximately at the “mid point” between its January 2011 high near $33 and its November 2012 low near $12. Here is a chart showing the YTD chart of ERF with the 8 and 21-day EMA’s and the 50-day SMA:
As you can see, for most of this year, the 8-day EMA has been a very reliable guide in trading ERF, and it has not traded below the 50-day SMA since February.
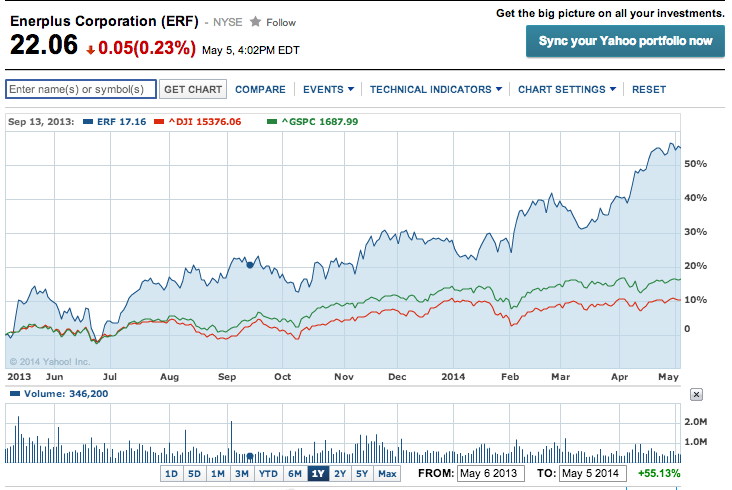
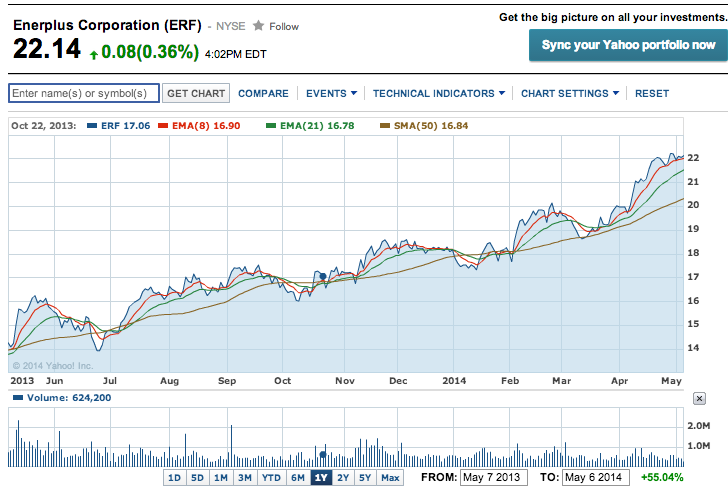
A similar pattern of price movement can be seen in the 1-year Chart:
Finally, you might want to join me in taking a good look at ERF earnings when they are reported on May 9th. If ERF “misses” those earnings, I’d pass on the stock until it shows positive steps toward harnessing the “tailwind” of escalating gas and oil prices! If, on the other hand, ERF is deemed to “hit a home run” on earnings and come anywhere close to $0.23-0.24/share, a bull put under support could be appealing.
DISCLOSURE: the author does not own ERF. Nothing in this article is intended as a recommendation to buy or sell anything. Always consult with your financial advisor regarding changes in your portfolio – either subtractions or addition.
[2] These projections are drawn from the analysis reported at http://seekingalpha.com/article/2178483-enerplus-what-statoils-q1-results-infer-for-enerpluss-q1
Related Posts
Also on Market Tamer…
Follow Us on Facebook

 Why Airline Stocks Fell Today

