Have you noticed? 2013 has been quite a year in the restaurant industry:
1) A world-class chef (Charlie Trotter from Chicago, IL) with two restaurants that received a “one star” or “two star” rating from the renowned Michelin Guide died suddenly (from a stroke) and dominated Chicago newspapers for a week;
2) QSR Magazine’s annual “Drive-Thru Performance Study” provided the metrics of a trend with which we were already well-familiar: namely, “fast food” has slowed considerably.
a. In contrast with the all-time record set by Wendy’s (WEN) in 2003 of just 116 seconds (that’s the average time between customers submitting a drive-in order and receiving that order) the industry average for the 2013-year was 180.5 seconds! (56% slower than WEN ten years earlier!)
b. More startling, McDonald’s (MCD) scored the slowest drive-through time ever in their long history (189.5 seconds).
c. Just as bad, order accuracy was also on the decline.
i. The industry-wide record for order accuracy in 2013 was just 87.2%.
ii. During 2012, accuracy had been 88.8%.
d. Once you know that most of the major fast food chains pull in 60-70% of their annual $299 billion in business via the drive-thru operation, you understand the magnitude of one of the food industry’s biggest current challenges – improving efficiency without compromising variety and quality!
3) In part due to some of the above struggles, January saw stalwart food giant MCD announce the first ever quarterly loss in its history! Remarkably, things have been so difficult at the normally mega-successful MCD, that its executives have been quoted at several points this year making rare public admissions of mistaken decisions (such as expanding its menu too fast).[1]
4) Major dining chain, Darden Restaurants (DRI)[2] has experienced negative sales trends and become so frustrated by various less than successful efforts to turn things around (heavy promotions, menu adjustments, lowering of costs, etc.) that December found them make an almost inconceivable announcement!
a. Pasta-centric Italian restaurant Olive Garden (one of my very favorite restaurants) will start offering a “hamburger” (of all things).[3]
5) Indirectly related to DRI, we witnessed remarkable changes at one struggling restaurant chain: Ruby Tuesday (RT):[4]
a. In December 2012, former DRI executive, J.J. Buettgen, replaced RT founder, Sandy Beall, as CEO.
b. By the end of October 2013, virtually all former RT lead management executives had been moved out by Buettgen, replaced for the most part by his former colleagues from DRI.
c. During the final weekend of October, RT Board Chair, Matthew Draper[5], suddenly resigned from the board, revealing that he had sold all of his 1.45 million shares.
i. No explanation was offered.
ii. RT stock tumbled by almost 6%.
iii. The Board elected Buettgen as Chair.
d. In December, substantiated rumors circulated that RT is exploring “strategic options” with Goldman Sachs.[6]
i. The stock spikes almost 8%.
6) Various strategies have been initiated to strengthen restaurant sales, the most obvious ones appearing within the fast food space:
a. Remodeling efforts (note the number of reformulated McDonalds stores around you);
b. Expanded promotions (I have received countless more special offer booklets from MCD, WEN, and Burger King (BKW) than ever before!).
c. Testing new items for expanded menu formulations.
d. Introducing mobile apps, such as the McD – an app that sends customers offers they can redeem through their phones at participating locations.
My interest was literally drawn into the restaurant arena this month by a combination of the unusual activity in RT, the fact that I had managed to provide myself a week of extraordinarily affordable evening meals at the start of December by using 2 for 1 coupons for Whoppers, chicken sandwiches, fish filet, etc., and a sudden 14 hour trip I had to make by car – during which I had the opportunity to survey the restaurant landscape over a wide swath of territory.[7]
As I began to examine investment opportunities within this space, I was fully expecting unremarkable performance figures. However, to the contrary, I was actually blown away by the returns actually realized this year in such names as WEN, Chipotle Mexican Grill (CMG), Brinker International (EAT)[8], Dunkin’ Brands (DNKN) and Starbucks (SBUX) – all of which have outperformed the S&P 500 on a YTD basis! Within this group, WEN has earned the “Geez, look what I could have made in that stock” Award—having moved up almost 80% since January 1st… with CMG a very close second!
As regular readers know, I often find it helpful to track down the ETF’s that track the particular industry I am currently studying. Within this space, the ETF that caught my attention is PowerShares Dynamic Leisure and Entertainment Portfolio (PEJ). The fund currently owns about thirty stocks – with about half of those being in the restaurant space. The ETF is based upon the Dynamic Leisure & Entertainment IntellidexSM Index. According to the Invesco PowerShares website, this Index evaluates companies based on a variety of criteria[9]. The Index is rebalanced and reconstituted each quarter, in February, May, August and November, so the PEJ ETF just went through a quarterly rebalancing. I found it interesting to review the changes that were made in November.
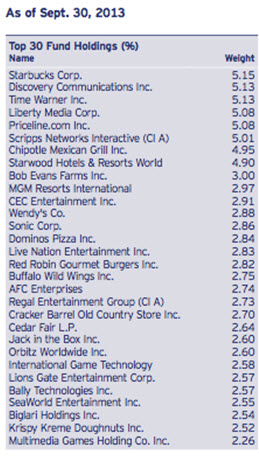
Here were the holdings within PEJ as of September 2013 (see the box below):
 Notice that, among the top sixteen names, there were nine restaurants:
SBUX 5.15%
CMG 4.95%
Bob Evans Farms (BOBE) 3.00%
CEC Entertainment (CEC)[10] 2.91%
WEN 2.88%
Sonic Corp. (SONC) 2.86%
Dominos Pizza Inc (DPZ) 2.84%
Red Robin G. Burgers (RRGB) 2.82%
Buffalo Wild Wings Inc (BWLD) 2.75%
AFC Enterprises (AFCE)[11] 2.74%
Cracker Barrel (CBRL) 2.70%
Jack in the Box (JACK)[12] 2.60%
Biglari Holdings Inc. (BH)[13] 2.54%
Krispy Kreme Doughnuts (KKD) 2.52%
There were 14 restaurants within the entire list of 30 holdings!
Below is a download from the PEJ website of the current holdings, following the November rebalancing:
|
TICKER |
SHARES |
WEIGHT |
NAME |
|
WYNN |
56,830 |
5.503647 |
Wynn Resorts Ltd |
|
SNI |
126,376 |
5.435934 |
Scripps Networks Interactive Inc |
|
LVS |
131,507 |
5.365153 |
Las Vegas Sands Corp |
|
TWX |
143,455 |
5.010292 |
Time Warner Inc |
|
HOT |
126,563 |
5.003631 |
Starwood Hotels & Resorts Worldwide Inc |
|
DIS |
133,632 |
4.957002 |
Walt Disney Co/The |
|
PCLN |
7,906 |
4.933878 |
Priceline.com Inc |
|
SBUX |
115,718 |
4.707438 |
Starbucks Corp |
|
IILG |
191,997 |
2.900161 |
Interval Leisure Group Inc |
|
SONC |
259,812 |
2.803231 |
Sonic Corp |
|
PZZA |
60,580 |
2.781055 |
Papa John's International Inc |
|
BYI |
68,951 |
2.751307 |
Bally Technologies Inc |
|
RGC |
263,947 |
2.747995 |
Regal Entertainment Group |
|
DPZ |
74,377 |
2.741932 |
Domino's Pizza Inc |
|
RCL |
116,724 |
2.718414 |
Royal Caribbean Cruises Ltd |
|
JACK |
108,589 |
2.714679 |
Jack in the Box Inc |
|
DENN |
714,122 |
2.690088 |
Denny's Corp |
|
BH |
10,600 |
2.684463 |
Biglari Holdings Inc |
|
DIN |
61,116 |
2.681595 |
DineEquity Inc |
|
CBRL |
47,393 |
2.664801 |
Cracker Barrel Old Country Store Inc |
|
WEN |
597,175 |
2.663187 |
Wendy's Co/The |
|
VAC |
98,424 |
2.660885 |
Marriott Vacations Worldwide Corp |
|
CAKE |
105,470 |
2.659745 |
Cheesecake Factory Inc/The |
|
FUN |
103,247 |
2.654296 |
Cedar Fair LP |
|
H |
106,299 |
2.652332 |
Hyatt Hotels Corp |
|
EAT |
109,328 |
2.642281 |
Brinker International Inc |
|
DNKN |
104,975 |
2.603076 |
Dunkin' Brands Group Inc |
|
FRGI |
104,996 |
2.601919 |
Fiesta Restaurant Group Inc |
|
BWLD |
34,223 |
2.598227 |
Buffalo Wild Wings Inc |
|
RRGB |
64,505 |
2.467357 |
Red Robin Gourmet Burgers Inc |
We can quickly notice several changes:
1) Restaurant additions:
a. Pappa John’s (PZZA)
b. Denny’s (DENN)
c. DineEquity (DIN)[14]
d. Cheesecake Factory (CAKE)
e. Brinker International (EAT)
f. Fiesta Restaurant Grp (FRGI)
2) We see that now, within the top 16 holdings, there are only five restaurants.
3) Within the entire portfolio, there are 16 restaurants… but the most of those names appear toward the bottom of the relative weightings list.
Here is some other information that is crucial to know in order to understand PJE:
1) Besides restaurants, this ETF includes stocks in such areas as “Casinos/Gaming”, “Media”, “Movies/Entertainment”, “Hotels/Resorts/Cruise Lines”, and “Amusement Parks”.
2) There are (of course) other ETFs that include restaurant stocks in their portfolio. Here is a listing of a few of the more obvious ones: XLY (SPDR Consumer Discretionary), VCR (Vanguard Consumer Discretionary), FXD (First Trust Consumer Discretionary AlphaDEX), and IYC (iShares DJ/U.S. Consumer Services Sector).
a. However, it is important to note that none of the ETF’s above incorporates as high a weighting in restaurant shares as does PEJ!
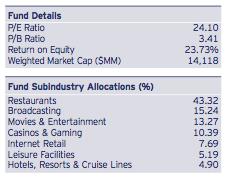
 3) Some key metrics for the ETF are included in the picture to the left (from the website):
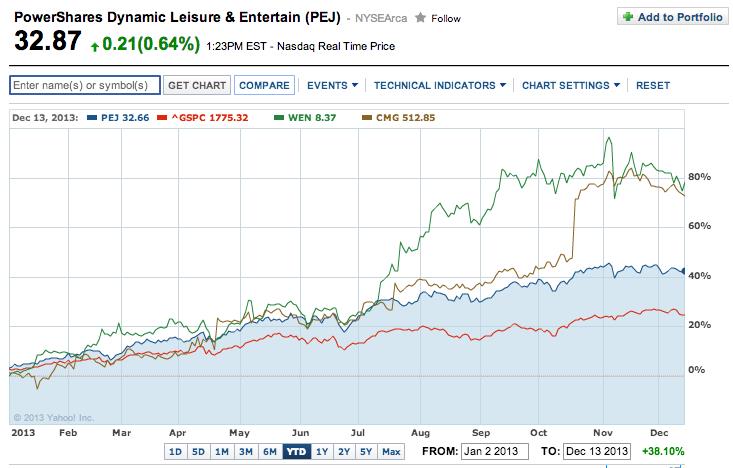
Finally, here is a look at some performance charts:
The first YTD chart contrast PEF (blue) with the S&P 500 Index (red), CMG (brown), and WEN (green):
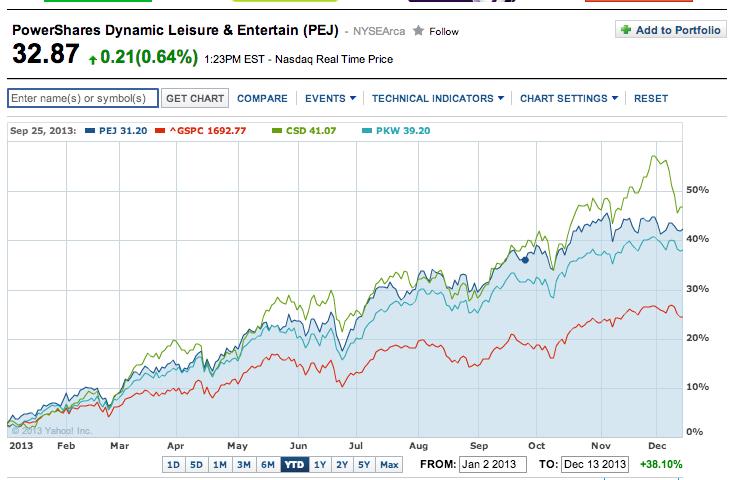
Finally, because we have highlighted at several points in prior months the outstanding performance put in by stocks that focus on “returning shareholder value” through dividends and/or share buybacks, here is the YTD chart of PEJ (blue) vis-à-vis Guggenheim Spin-off (CSD)(green), PowerShares Buyback Achievers (PKW)(light blue), and the S&P 500 (red).
We can quickly see that PEJ has acquitted itself extremely well during 2013!
I encourage you to explore PEJ’s performance through other time periods. I was impressed that it has sustained solid performance over longer periods of time.
INVESTOR TAKEAWAY: Obviously, there has been a lot more than restaurant stocks powering PEJ performance! The group that jumps to mind most readily is the “Casinos” group, which has enjoyed a number of very hot periods of upward movement in 2013. That being said, I came to at least one new point of self-awareness through my review of these stocks and this ETF:
I have been large insular with regard to my perception of restaurant stocks during the past year. The ones I most often frequent have been struggling, so I blithely assumed that the “group” has been struggling, as well – which (as you’ve seen above) is clearly not the case! This has led me to a commitment to try to expand the “peripheral vision” of my company (and stock) awareness. I certainly wish I had been more alert to the movements of WEN! Because the media focuses so much on MCD, I had largely closed my mind to WEN and Burger King (BKW).
DISCLOSURE: The author doe not currently own PEJ or any of the restaurant stocks mentioned above.Nothing in this article is intended as a recommendation to buy or sell anything. Always consult with your financial advisor regarding changes in your portfolio – either subtractions or additions.
Submitted by Thomas Petty MBA CFP
[1] The loss included charges of $656.9 million after taxes, mainly to cover the cost of closing 719 restaurants; exiting Bolivia, Paraguay and Trinidad; restructuring in the Middle East; cutting some 600 jobs; and ending a multiyear technology project.
[2] Company brands include Olive Garden, Red Lobster, Longhorn Steakhouse, Capital Grille, Bahama Breeze.
[3] So OK… I admit it is an “Italian Burger” – a six-ounce burger topped with crispy Italian prosciutto; mozzarella cheese; arugula; tomatoes marinated in fresh basil, garlic and Italian spices; and a garlic aioli spread. It will be served with parmesan-garlic fries and a choice of Olive Garden's unlimited soup or salad and breadsticks.
[4] See https://www.markettamer.com/blog/goodbye-ruby-tuesday for helpful detail about Ruby Tuesday.
[5] Compounding the surprise and mystery of Draper’s action, he had only been Chair for about a year!
[6] I am uncommonly interested in knowing what the “Golden Parachute” provisions are in Buettgen’s contract!
[7] Since I traveled mostly at night, I came to develop special appreciation for the “24 hour” or “Open to 1 AM” locations!
[8] EAT runs the Chili’s Grill & Bar and Maggiano’s Little Italy brands.
[9] Including price momentum, earnings momentum, quality, management action, and value.
[10] Chuck E. Cheese’s brand restaurant.
[11] Popeye’s Louisiana Kitchen (Chicken) brand restaurant
[12] Includes Qdoba Mexican Grill, along with the Jack in the Box brand
[13] Used to trade as “Steak n Shake” and it includes Western Sizzlin’
[14] Includes the IHOP and Applebee’s brands.
Related Posts
Also on Market Tamer…
Follow Us on Facebook


 Investing $60,000 in These 3 Funds Could Generate Annual Income of Over $6,500