Love “Trivia Quizzes”?[1] Here is a new Quiz for you:
Without doing a “Google” Search[2] what does “Mutatis Mutandis”[3] mean and to what could it refer within the realm of ETF and Fund Investing?
Give up??
Are you sure?!!
At a 2012 Morningstar Conference, Craig Lazzara was a guest expert for a panel discussion regarding “Low Volatility Versus High Dividend: Which One Is Better?” The intent of the panel discussion was to shed light on “Smart Beta” – since both “Low Vol” and “high dividend” are factors used within popular “Smart Beta” funds.
Craig is the Senior Director, Index Investing Strategy, at S&P Dow Jones Indices.[4]
Craig was asked about how his team created a “Low Volatility Index”. Specifically, he was asked which main metric was applied to equity data in the framing of an effective strategy?
The details of his answer are a bit complicated, but once you know that a truly useful “Smart Beta” factor needs to be applicable across all market groups (ie. US, Developed World, Emerging Markets, etc.) then light is shed upon how “Mutatis Mutandis” is tied to the development of a “Low Vol” strategy!
Craig’s team started with the U.S. large cap market (in about mid 2010) and proceeded by [in his words]:
“taking the 500 stocks in the S&P 500, measure their trailing standard deviation, each of the 500 stocks… [then] the 100 with the lowest volatility become the constituents of the Low Vol Index, and then importantly those constituents are weighted inverse to their volatility.”
Through extensive back testing, Craig and his team decided upon using a standard “trailing period” for the strategy of one year.
That practical formulation of a “Low Vol” strategy proved to be so successful within the U.S. large cap space that Craig tells us his team then applied the formulation “mutatis mutandis” (in this context, meaning: “with necessary minor adjustments”) to the mid-cap and small cap U.S. markets. Finally, that formula was adapted “mutatis mutandis”[5] within Developed and Emerging Markets throughout the globe!!
Friends, if you actually knew what that term meant without doing an Internet Search, my hat goes of to you! I personally know a considerable amount of nearly useful and arcane information – but until this week, I did not know that particular piece of useless and arcane information![6]
Why are we focusing on “Smart Beta” again? There are lots of reasons to review what is happening in “Smart Beta”, but those reasons can be summarized as follows:
1) It is a relatively new concept (the first few funds based upon it were introduced in 2006);
2) The theories and concepts behind it can prove complicated and confusing;
3) Recently, ETFs and funds based upon one or more of its subcategories have demonstrated superior performance;
4) It is becoming harder to read investment and financial advisor magazines and blogs without the term popping up nearly every day;
5) Institutions, pension funds, and very large investors are becoming increasingly interested in “Smart Beta”; and
6) It is important to keep you (and the average investor) aware of the ins and outs of “Smart Beta” so you will be equipped to separate the “hype” and the “marketing baloney” from reality![7]
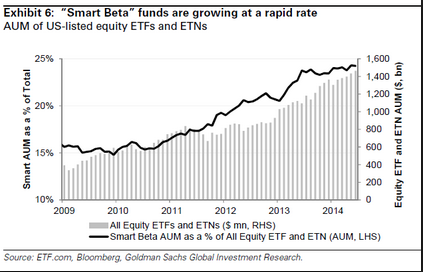
Illustrative of the new waves of interest in “Smart Beta” is the article that appeared in CFA Magazine reporting that “pension funds around the world have increased allocation to such strategies.” Based upon data from State Street Global Advisors, a report that appeared in the Economist indicates that although (at the time of the report) just $142 billion was actually allocated to Smart Beta funds[8], the first quarter of 2014 saw $15 billion in new funds flow into Smart Beta – which is 45% higher than the first quarter of 2013! So in the “land of investment management”, Smart Beta is “hot”!! [I happen to agree with the Economist that this trend is occurring despite the fact that “Smart Beta” is a terrible name!]
What is the main appeal of “Smart Beta”? This may sound like a smart aleck answer, but the main appeal is that it is not a market capitalization weighted (“cap-weighted”) strategy!
Think about that for a moment. As we highlighted in our prior article, it is ironic that the vast majority of dollars invested in equities are invested in cap-weighted instruments; and yet the considerable vulnerabilities of a cap-weighted strategy are well documented! The simplest and most easily grasped vulnerability is this:
When your ETF or fund tracks a cap-weighted equity benchmark, it will (by definition) end up holding more and more of what has gone up in value and less and less of what goes down!
Now on the surface, that sounds like a great result!! However, cap-weighted instruments are subject to the damaging after effects of “Bubbles” (both large[9] and small[10]
So we don’t necessarily need to outperform the Market (that is referred to as “Alpha”), but we do want to achieve a return comparable to the Market (since a “Beta” of 1.0 is, by definition, the return/exposure of the S&P 500 Index, let’s call a “comparable return” “Beta”!), while simultaneously lowering the “risks” inherent in cap-weighted funds!
There you have the essence of “Smart Beta” – an investment approach that focuses upon improving risk-adjusted returns by tracking an index that is not predicated upon one of the mainline cap-weighted indices!
In our prior article, we highlighted “Low Vol” ETFs within the “Smart Beta” category. Let’s brainstorm another variable within the investment process that could be used to develop a “Smart Beta” strategy!
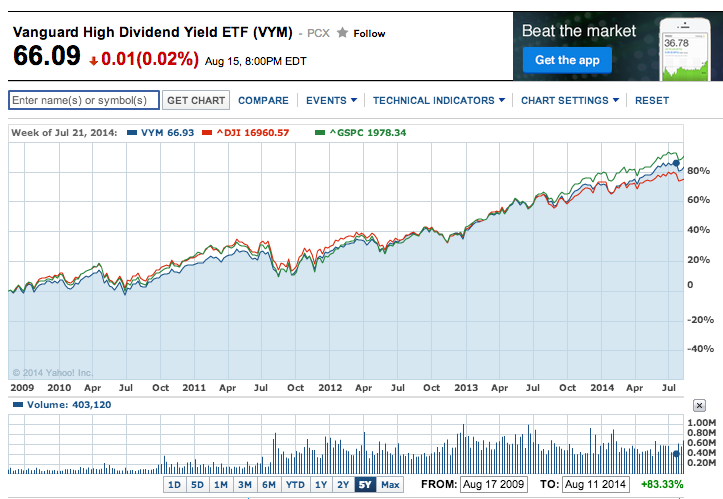
How about the possibility of “High Dividends”?? As an example for the purpose of quick analysis, we can use Vanguard High Dividend Yield ETF (VYM). VYM reports a current yield of 2.83% — about 48% higher than the yield on the S&P 500 Index (1.91%).
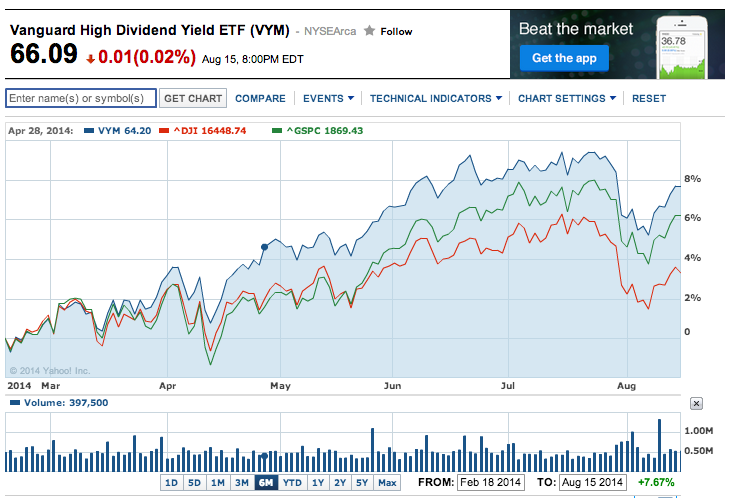
During the past six months, VYM has handily outperformed both the S&P 500 and the Dow Jones Index
Keep in mind that if we include the higher dividend of VYM, the outperformance is greater! (The DJ Index yield is 2.03%).
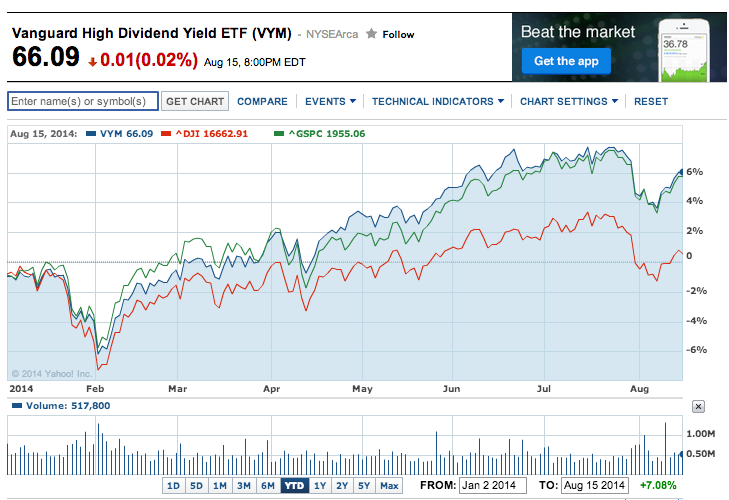
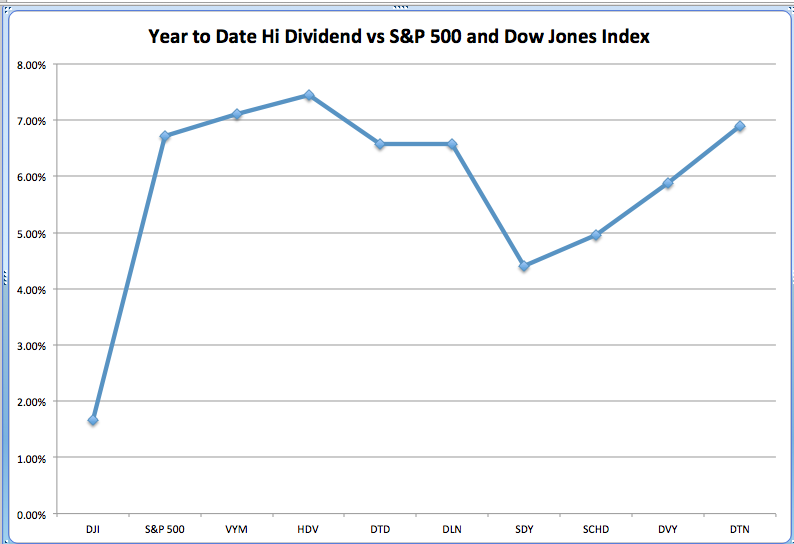
On a Year-to-Date (YTD) basis, VYM generated a return comparable to that of the S&P 500, and much better than the Dow Jones Index! (Don’t forget the “Yield” kicker.)
How about over longer periods?
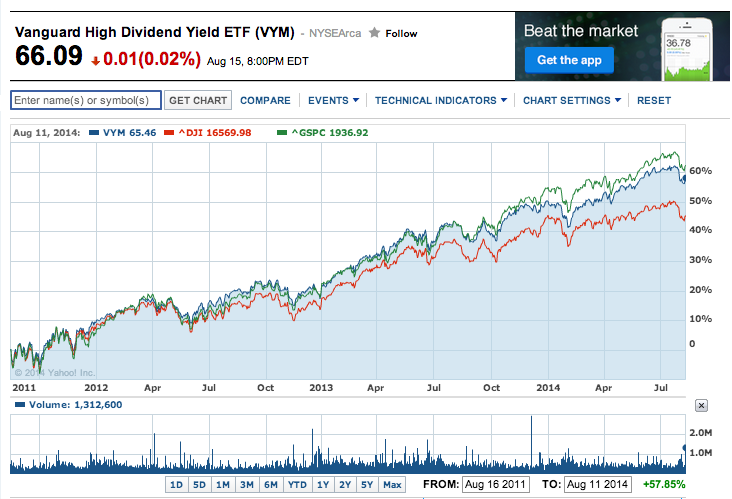
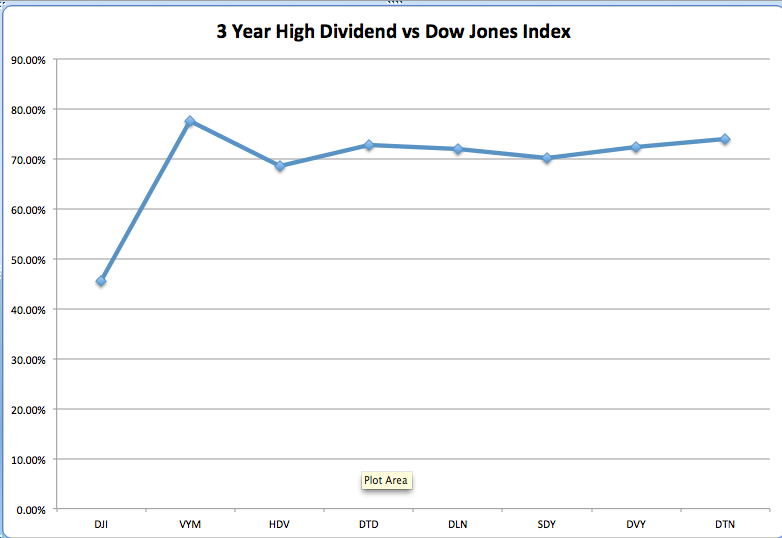
Once again, over the past three years, VYM is about even with SPY, but has managed that with a significantly better risk-adjusted return!
Over the past three years, VYM has once again produced a return comparable to the S&P 500 and at least 15% higher than the Dow Jones! In addition, here is data (from YahooFinance.com) on relative Beta and Sharpe Ratio metrics for VYM , SPY (as a proxy for the S&P 500), and DIA (proxy for the Dow Jones Index):
|
3 Years |
VYM |
SPY |
DIA |
| BETA | 0.77 | 1.0 | 0.91 |
| SHARPE RATIO | 1.68 | 1.33 | 1.17 |
In case you are not totally conversant with the “Sharpe Ratio”, here is a quick definition of this metric:

Sharpe Ratio helps is focus on RISK-ADJUSTED RETURN. (A higher number is better than a lower number.)
Since a “higher” Sharpe Ratio indicates better “risk-adjusted” performance, we can see that VYM, during the prior three years, has very significantly outperformed both SPY and DIA. As we’d expect, the Beta metrics confirm that VYM is 23% less volatile than SPY and 14% less volatile than DIA!
If we look back 5 years, the graph isn’t nearly as compelling; however, if we take a look at the BETA and SHARPE metrics, we get a similar picture:
|
5 Years |
VYM |
SPY |
DIA |
| BETA | 0.85 | 1.0 | 0.90 |
| SHARPE RATIO | 1.42 | 1.24 | 1.23 |
VYM has clearly delivered significantly better risk-adjusted performance than either SPY or DIA over the past five years!
So we have, indeed, identified another category of investment strategy within the larger umbrella of “Smart Beta”: the High Dividend Strategy!

Using Dividend payments as a criteria for Smart Beta portfolio design has become a popular methodology!
Let me quickly interject two important disclaimers:
1) Obviously, VYM is not the only available “High Dividend” Smart Beta offering…
2) Nor is VYM necessarily “the best” High Dividend choice![11]
There are a number of different methodologies used by ETF managers to determine which High Dividend stocks they want to include in their respective “Smart Beta High Dividend Index”!
To oversimplify, consider this: back in 2012, there were about 1,300 U.S. stocks that paid dividends. As you can imagine, those stocks can be found within the small, mid, and large cap spaces… and they include stocks from almost every industry sector (with a heavy proportion within the “Utility” and “Telecom” spaces). To put it mildly, there are a lot of different ways of “slicing and dicing” that “Dividend Payers” into a “High Dividend” ETF or fund!
It will be up to you to research and evaluate the index methodology used by each “Smart Beta High Dividend” offering! But some of the more common ways that are used to create a High Dividend ETF include the following:
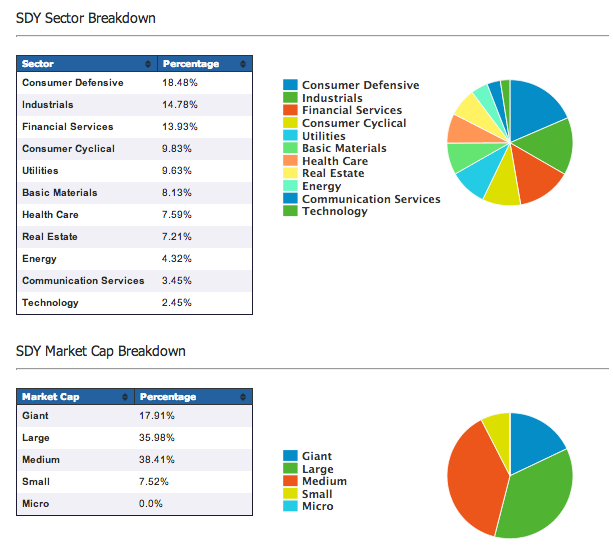
1) To reassure investors still spooked by the 2007-09 “Crash” and the biggest drop in “dividends paid” since the Great Depression of 1929, many managers have built their index upon certainty, stability, and persistence of dividend payments! They use a “look back” period ranging between 10 years and 25 years of (variously) consecutive annual dividend payments, no reduction in dividend amount, and/or annual increase in dividend amount, etc. An example is the S&P High Yield Dividend Aristocrats (SDY) – requiring 25 years of dividend increases!
2) Some managers emphasize a “forward-looking” methodology that projects which companies will be able in increase dividend payments going forward because of growth in sales and earnings! Those fund offerings tend to carry a lower yield.
3) WisdomTree has adopted an intriguing methodology for at least some of their offerings that it describes as follows:
“dividend-stream weighted, so it's dividends per share times shares outstanding for the vast majority of our indexes. It's going to give bigger weight to bigger companies, be more representative of the market.”
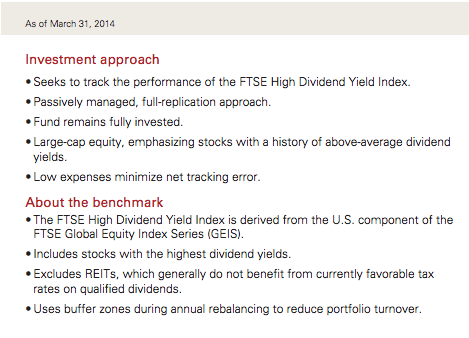
In the case of VYM, its methodology does not fit “neatly” into any of the above categories, but it does emphasize a “history of above average yield“:
As you can imagine, these different methodologies result in distinctly different-looking portfolios of dividend payers. The “Aristocrats”, of course, will include a lot of long lived, financially solid, large cap stocks (Johnson & Johnson, Proctor & Gamble, etc.) and a lot of public utilities, but none of the big technology stocks that have recently started to pay dividends (the biggest example being AAPL!).
In contrast, WisdomTree’s strategy does include AAPL for portfolio inclusion, and depending on other factors, the forward-looking methodology (suggested in 2) might also include it. None of these methodologies is any “better” than the other – each is suited for a different type of investor need!
Another factor to consider when looking for a fund is the frequency of portfolio rebalancing! Some rebalance quarterly; others rebalance less frequently. This rebalancing discipline is one of the most effective ways that “Smart Beta” ensures that any given portfolio will not become “top heavy” with a few hot stocks, only to suffer later!! So make sure your choice rebalances regularly!
Also, if any given “Dividend” ETF or fund promises a yield that sounds too good to be true (such as 12-14%) – it might just be too good to be true. In those instances, check out the ability of the portfolio companies to sustain that yield moving forward. If a few key stocks in the portfolio are paying more in dividends than they report in earnings… that payout rate will not be sustainable.
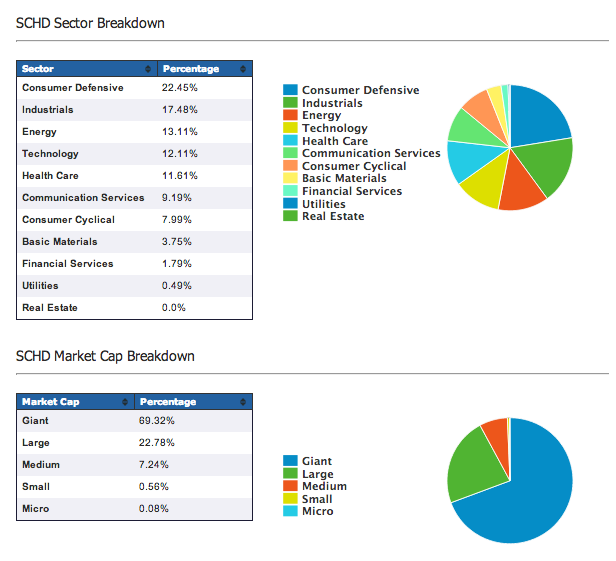
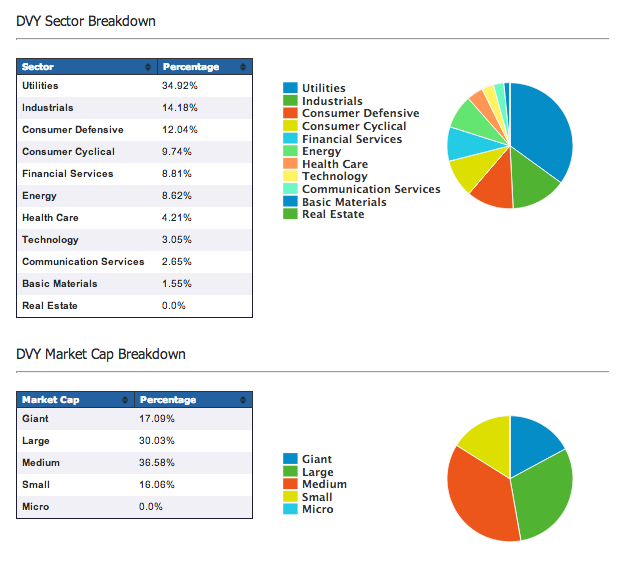
If you are interested in learning more about “High Dividend Smart Beta”, here is a small list of ETF choices that you might want to research further [the full list of available funds is huge!]:[12]
iShares Core High Dividend (HDV) ($4.12 B)
iShares Select Dividend (DVY) ($13.7 B)
Schwab US Dividend Equity ETF (SCHD) ($1.96 B)
WisdomTree Large Cap Dividend (DLN) ($1.81 B)
WisdomTree Total Dividend (DTD) ($481 M)
WisdomTree Dividend Ex-Financials (DTN) ($1.18 B)
Vanguard High Dividend Yield ETF (VYM) ($12.3 B)
For your convenience, here are two graphs that suggest relative performance YTD and over the past 3 years (a standard time period for evaluation of relative return):
INVESTOR TAKEAWAY:
Although there is absolutely no assurance that “past performance” will bear any resemblance to “future performance”, it is interesting to confirm that some of these relatively “boring”, unglamorous High Dividend ETFs have delivered a significantly better risk-adjusted return compared to the S&P 500 Index (and even more significantly – the Dow Jones Index!).
As has been pointed, of course, that is the whole point of “Smart Beta” – better risk-adjusted investment return!
If you follow up this article by digging more deeply into investment offerings within this space, I suggest a couple of cautions:
1) Make sure you know what investment criteria are most important to you! Will 25 years of steady dividend payments (and even increases) help you sleep better at night, or will the potential of getting a greater future return through a higher dividend growth rate suit your needs better?
2) As you read the promotional material from fund providers (and especially from brokers) be very intentional about trying to separate marketing hoopla and hype from those metrics and issues that are most important to your future investment returns!
3) Make sure you know what each fund’s “Expense Ratio” is (how much it costs you to have the fund managed). Compare that to the standard index expense ratio (between 7% and 15% these days) and then consider if the incremental return you expect to earn is worth the extra cost.
Good luck to you in any further research you do!
DISCLOSURE:
The author owns (and has owned for years) VYM (as well as its cousin, VIG). He has also traded SPY and DIA. Nothing in this article is intended as a recommendation to buy or sell anything. Always consult with your financial advisor regarding changes in your portfolio – either subtractions or additions.
APPENDIX:
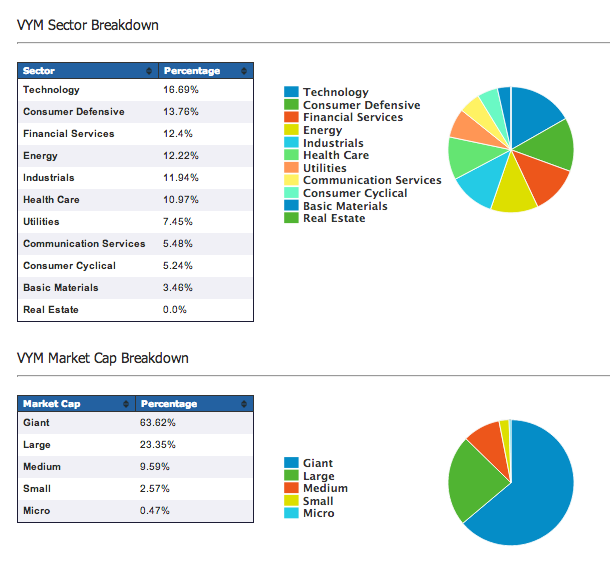
VYM
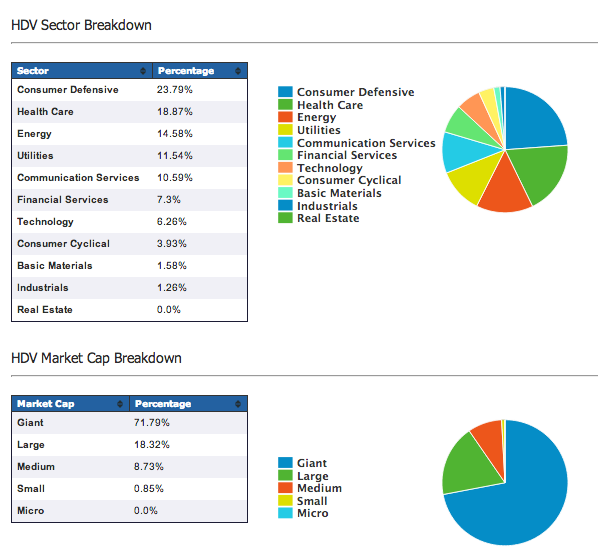
HDV
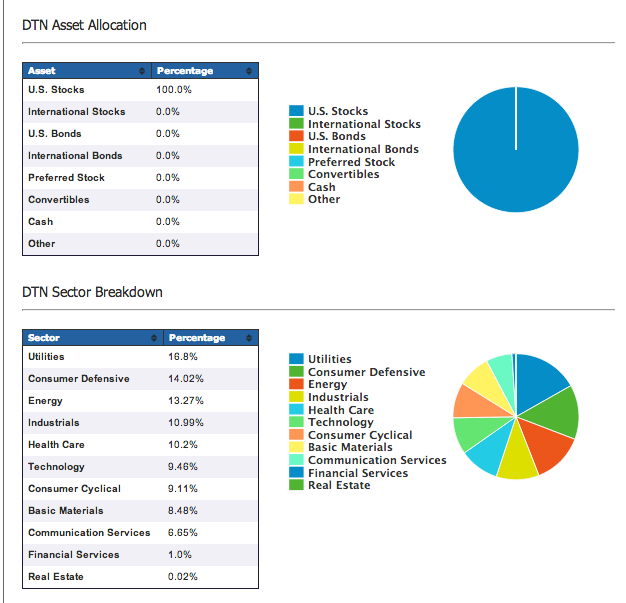
DTN
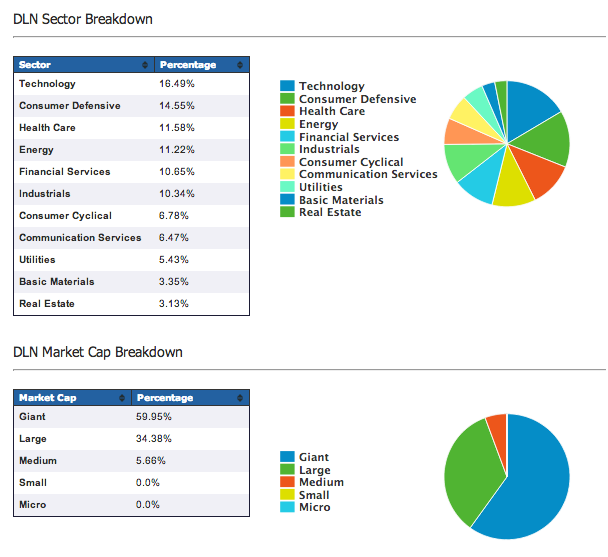
DLN
SDY
SCHD
DVY
FOOTNOTES
[1] They only wonder why there is no reward for getting the correct answer!
[2] OR a Bing, Explorer, Foxfire, Ask, or any other type of Internet Search….
[3] Syllabification: mu·ta·tis mu·tan·dis
Pronunciation: /m(y)o͞oˈtätəs m(y)o͞oˈtändəs, -ˈtātəs, -ˈtandəs
[4] When it comes to Indices, Craig is (as they say): “da Man!”
[5] The dictionary indicates that this term is used when one compares two or more related cases or situations and finds that a few adjustments are necessary … adjustments that do not change (or negate) the main point at issue!
[6] God bless him! I think Craig would fit perfectly well within the Higher Education setting. Using highfalutin terminology has always been a specialty of Higher Ed! As for me, give me the “Ron Popeil School” of ETF analysis!! See ________________________________________________________
[7] This is particularly important since Smart Beta funds tend to cost more than Index Funds!
[8] A figure dwarfed by the total of ETFs and mutual funds in the marketplace.
[9] Such as the “Dot.com Crash”
[10] Such as Apple Inc (AAPL) after mid-September of 2012.
[11] Only YOU can discern what investment is “best” for your unique financial needs!
[12] The dollar figure in parenthesis is the reported Total Assets Under Management – a reflection of liquidity.
Related Posts
Also on Market Tamer…
Follow Us on Facebook



 2 Quantum Computing Stocks That Could Supercharge Your Portfolio
