The world of technical analysis can be a confusing place. There are well over 100 different methods that you could apply to try to predict a stock’s price movement. Most methods are obscure and esoteric, so it pays to focus on the most beneficial methods. One of the most popular, and certainly one of the best methods is Bollinger Bands.
Bollinger Bands is an analysis of how volatile a stock is. If the stock price is moving slowly, it is not very volatile. If it is jumping around a lot, it is very volatile. Bollinger Bands looks back at the volatility over the previous 20 days and predicts statistically, based on that volatility, that 95% of the time, the stock will be within the upper and lower Bollinger Bands. (Note that you can typically change the parameters, but the common usage is with a 20-day moving average and upper and lower lines 2.0 standard deviations above and below that moving average. 95% of the price activity will occur between the 2 standard deviation lines – the Bollinger Bands.)
So how can you trade based on Bollinger Bands? Stocks often have a tendency to “revert to the mean”. This means that if there is a significant jump in a stock price, there will often be some retracement of the stock. Because Bollinger Bands are drawn at 2 standard deviations away from the moving average, it is by definition unlikely for a stock to close outside them. When it does, there is a strong likelihood that it will quickly come back inside the Bollinger Bands.
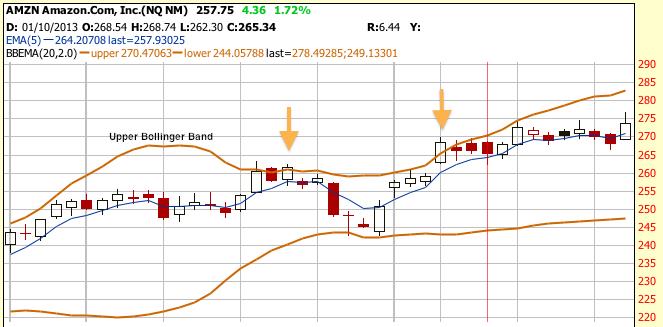
For example, if you look at a 2-year chart of Amazon (AMZN), you’ll find that the stock price closed above the upper Bollinger Band 17 times. In almost every case, the price was lower at some point over the next 3 days. If you were long AMZN, it was an ideal time to take some profits. If you went short at the close on those days for a short-term trade, you could usually make some money. During that same two-year period, AMZN closed below the lower Bollinger Band six times. In most of those cases you could have made money betting on a bounce back up. In the chart below, you can see two cases where the stock closed above the upper Bollinger Band (orange arrow). In both cases, the next day closed down.
While there is no guarantee (there never is in the stock market), Bollinger Bands are a good indicator that a stock is overbought or oversold. A close outside of the Bollinger Bands is usually followed by a reversal. Betting on that reversal will often be a profitable trade.
Submitted by John Marsland
Related Posts
Also on Market Tamer…
Follow Us on Facebook


 Move Over, Stock-Split Stocks: IPO Mania Is Taking Center Stage (and It's Probably Not Going to End Well)