How does this potential investment vehicle sound as an addition to your personal portfolio?
1) It is a major equity index, and therefore not subject to the volatile swings so common in individual company stocks – stocks that can be buffeted about by corporate news (eg.: approval or denial of a drug by the FDA; a lawsuit brought by another company or an investor; earnings announcements; etc.);
2) The country whose performance is reflected by this index has had new leadership in place since December of this past year;
3) The country reported economic growth of 3.5% for the most recent quarter;
4) Not surprisingly, this leadership has excited citizens and business leaders alike by its willingness to be bold in driving forward toward growth and prosperity within an economy that has been (for over twenty years) moribund.
5) The new leadership’s economic reform strategy has been packaged and trumpeted as the “Third Arrow” – including deregulation, free trade, and lowering corporate taxes.
6) Other national leaders are green with envy at the new leader’s public approval rate – currently exceeding 70%!
7) A major part of this new leadership’s strategy has been boldly “copied and pasted” from a world leader – in which its stock market has moved steadily from “lower left to upper right” for many months now.
By now you have certainly identified the index, the country, and the leader to which I have been referring:
a) The Nikkei 225 Index
b) Japan
c) Prime Minister Shinzo Abe
You also probably know whose strategy Abe has been mimicking: that of our own, infamous, Federal Reserve Chairman, Ben Bernanke.
During the fourth week of May, investors got a “chart full” of what can happen when far too many people and far too much money get far too excited about what appeared to be far too easy a solution to Japan’s long-standing economic malaise … and far too many investment advisers were far too vocal about what sounded like far “too sure” an investment: long the Nikkei 225 and short the Japanese Yen!
Here are some more data points for you:
1) Having wallowed in a long period of extended deflation, stagnation, and falling wages, Prime Minister Abe and the Bank of Japan (BOJ) board (which Abe packed after his election win three of “his people”) are on a quest to double Japan’s monetary base to 270 trillion yen by the end of 2014;
2) To facilitate this objective, the BOJ buys $76 billion in Japanese bonds each month (the Fed buys $85 billion/month… but the U.S. economy is much bigger).
3) The government’s goal is to push inflation up to 2% — yes, push inflation up to 2%, which is a wonderful thing when you’ve been mired in extended deflation!
4) As common sense would predict, and all those pundits trumpeted, the impact on the Japanese economy has been startling:
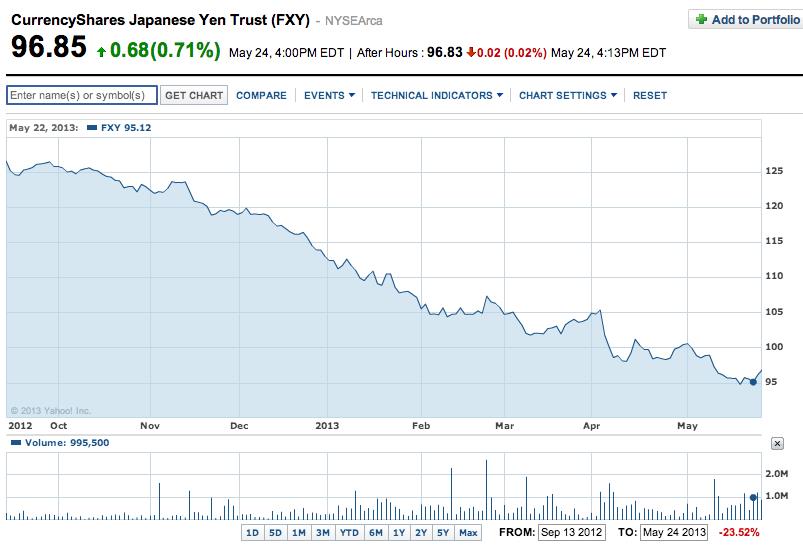
a. The Yen has not just “eased” against the U.S. dollar, the Euro, and other currencies… it has plummeted (relative to typical moves in major currencies):
GRAPH: The chart above shows the precipitous descent of the FXY ETF (a proxy for the Yen) from September through May, during which it fell over 25%! (Source: YahooFinance.com)
b) The steep decline of the Yen is the basis of this article’s title.
a. 円高 is the Japanese symbol for endaka which means “Yen expensive” … which has the effect of inhibiting exports
b. 円安 is the symbol for en’yasu which means “Yen inexpensive”… with the opposite impact.
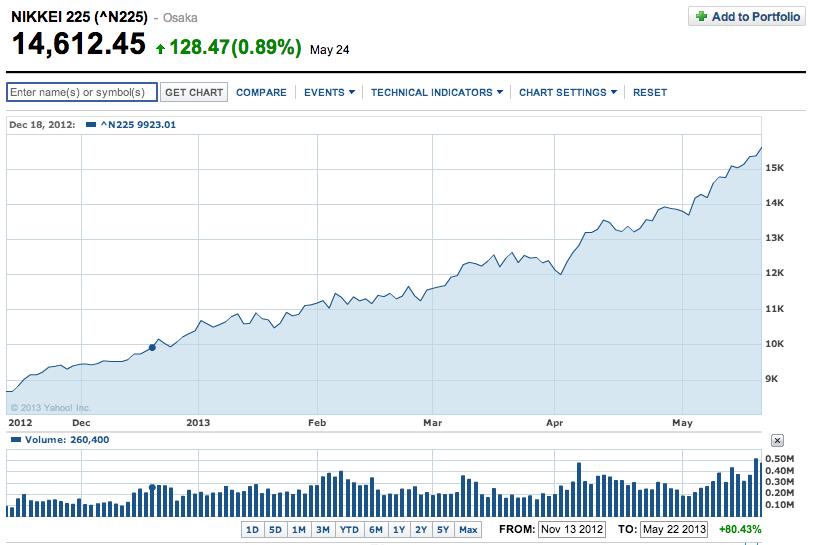
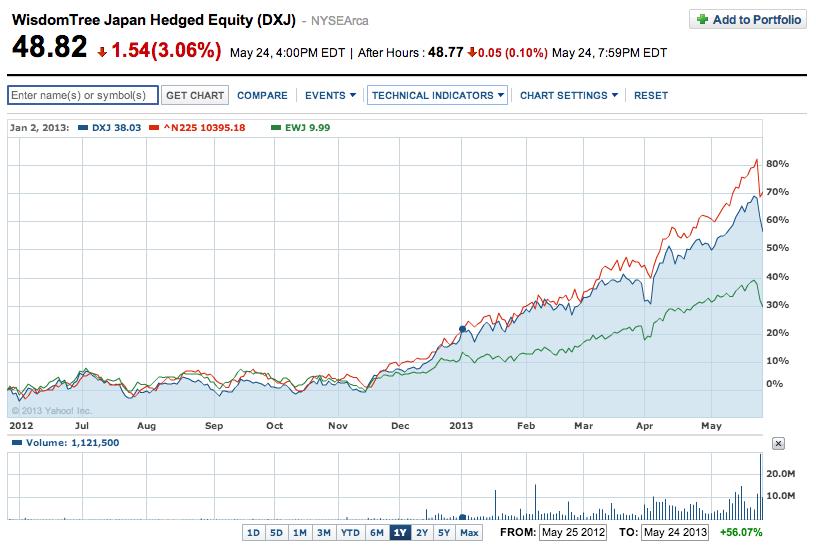
c) The NIKKEI 225 Index jumped by almost 39% between November (when it was evident Abe would win) to April. (See graph below right.)
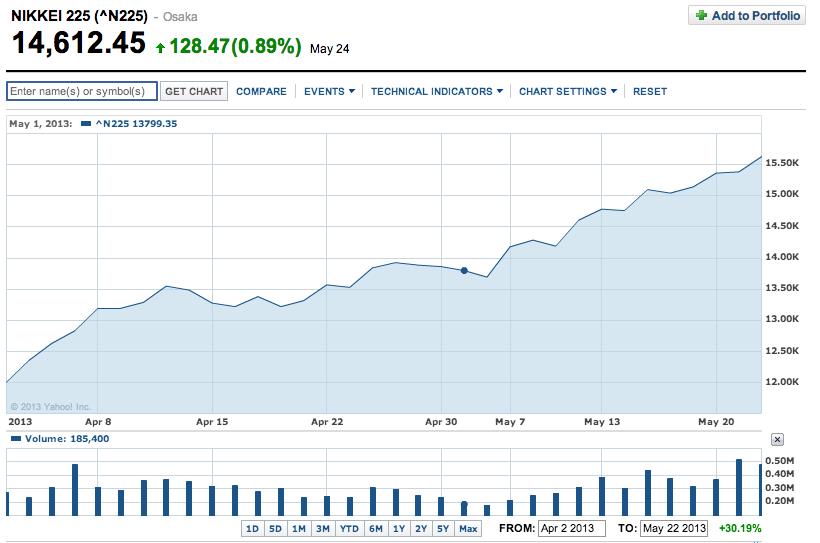
d) The NIKKEI 225 Index jumped an additional 30% between April and May! Yes, in one month! (See graph below.)
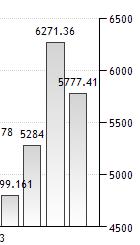
e) Japanese exports started to demonstrate an upward burst. (See partial graph below)
5) Meanwhile, one could hear echoes from the bygone days of the New York Central “Century Limited” and the Sante Fe “Super Chief” passenger trains: “All on board!!”
 a. Hedge funds and other institutional investors started piling into the Japanese market last fall;
b. Individual investor interest grew steadily during past months, but reached a crescendo in recent weeks.
c. The two major equity ETFs in the market grew assets under management as follows:
i. EWJ: now has $11.2 billion in assets, $7.3 billion of which was invested in the past four and a half months! Yes, that is correct!
ii. DXJ: now has $9.8 billion in assets, over $5.4 billion of which has arrived year to date!
iii. Other Japanese funds have received similar bursts of growth.
Well, my readers, what almost always happens when far too many people with far too much money jump into any investment far too quickly?? BINGO!
That very thing took place during the middle of the fourth week in May!
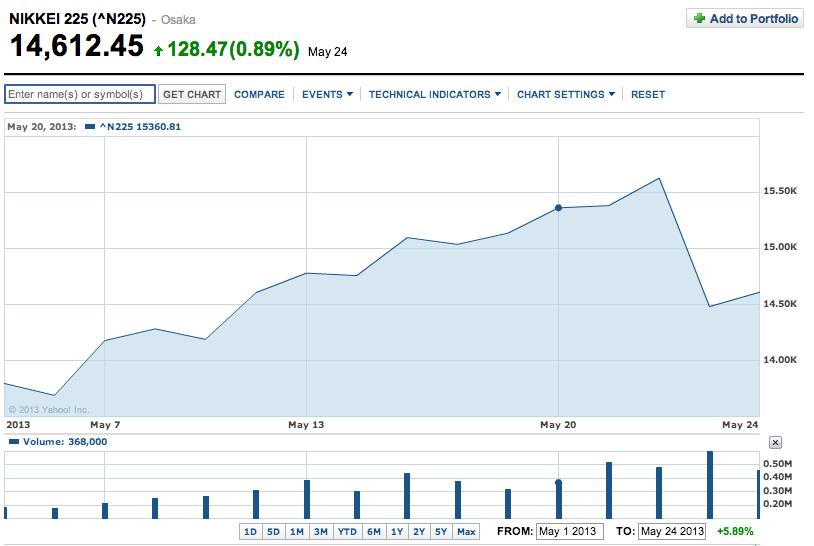
Take a look at the graph to the left. Do you see the steep cliff toward the right edge? THAT is what happened when the markets in Japan and around the world got real worried and pressed the “sell button”!
The Nikkei 225 Index plummeted over 1,100 points in one day (about 7.3%)!
That’s what happens when too many cattle are crammed into the corral and then something happens to spook the cattle — they all turn tail and try to head out of the narrow exit … and it is neither pretty nor orderly.
What happened to “spook the cattle”? Of course CNBC would be proud to give you an authoritative answer. But I am not nearly as bright as the regulars on “Fast Money” – so I can only offer you a list of news items that happened around the time of the steep drop, any or all of which may have contributed to the downward move:
1) The interest rate on the benchmark 10 year Japanese government bond surged over 1% for the first time in over one year!
a. OK. You are thinking: “So what?! Our 10 year bond rate is over 50% higher than that!”
b. The answer is: 1% is a round number and got lots of attention because of its psychological impact.
c. More germane: Japan is burdened with mountains of debt…. therefore, a government debt interest rate increase has great significance.
i. About 25% of the national budget is dedicated to interest payments on their debt!
ii. Japan’s national debt constitutes almost 18% of aggregate world government debt.
iii. Japan’s debt amounts to more than 210% of its Gross Domestic Product (GDP).
iv. One very positive compensating factor regarding Japan’s national debt is this – a majority of Japan’s debt is owned by its own citizens – who save at an exceedingly impressive rate!
2) Investors were quite aware that the year to date (YTD) performance of a long Nikkei 225/short Yen position had been extraordinary and unsustainable.
a. The Nikkei had been (hands down) the best performing international index in 2013;
b. Everyone was still aware of the significant fact that the Japanese Yen had not stood at over 100 yen per dollar for well over four years.
c. Any news regarding the factors that have pushed the markets to these levels were inevitably going to impact market psychology –
i. To that point, the U.S. Federal Reserve report on Wednesday had been quite confusing:
- Ben Bernanke’s public testimony placed on emphasis on “steady as you go “ with Quantitative Easing (QE).
- But he did admit that, at some point, the Fed would need to develop a plan to “wean” (my word, not his) the markets from QE.
- The minutes from the prior Fed meeting revealed the willingness of some Fed governors to move toward reducing QE sooner than later.
ii. The liquidity that the Fed has been injecting has been instrumental to markets all over the world, not just in the US.
iii. A slowing of QE in the U.S. would indirectly impact Japanese markets, and might conceivably impact the magnitude of BOJ easing.
I am confident there were other factors involved in the change in market sentiment as well, but as we in the U.S. know, it only takes a one or two percent move downward to spook the onset of larger and larger order flows to the downside!
There are a couple of additional points I need to add as I wrap up:
I) JAPANESE MONETARY POLICY
a. U.S. Treasury Secretary Lew has sent a not so subtle warning to Abe and the BOJ about this monetary policy that has had the impact of weakening the Yen — from around 80 to well over 100 (“80” means “80 Yen to the Dollar”… so as 80 moves to over 100, it takes more Yen to equal a Dollar… thereby producing a “weaker” Yen).
b. Just this year, the Yen has weakened by 17%.
i. That has great significance for U.S. exporters –
ii. Cars such as Toyota, Honda, Lexus, etc. become cheaper for U.S. customers vis-à-vis GM, Ford, or Chrysler cars
iii. If the current trend continues, Lew and the President will come under increasing pressure from U.S. exporters to “do something”.
c. In that context, in a recent TV interview, Lew said:
“The world has made clear that domestic tools that are designed to deal with domestic growth are within the bounds of what the international community thinks is appropriate, and that policies that are targeted to affect exchange rates are not.”
i. With all due respect, Lew’s comments may qualify him to be the “poster boy” for the dictionary entry for “hypocritical”:
ii. The U.S. Fed and U.S. Treasury have practically patented the “mega version” of monetary easing… which inevitably has the collateral consequence of “currency debasement”.
iii. It stimulates the domestic economy
iv. But it also puts downward pressure on the national currency
v. Thereby stimulating exports
vi. And (not insubstantially) keeping the cost of government debt cheaper – because of (generally) a lower interest rate and the fact that the government pays the debt back with “cheaper” currency!
vii. Every person in the world with an “Economic IQ” over 50 understands this
viii. But it does not stop the political game of “dissembling” — at which Bernanke, Geithner, and now Lew, have become masters.
d. Japan has been striving to build enough international good will to stem any serious opposition to their current policy efforts:
i. Japan now holds $1.12 trillion of U.S. Treasury debt… 26% higher than two years ago. Japan is second only to China in its ownership of U.S. debt.
ii. Japan already owns some of the European Stability Mechanism Bonds (ESM) (ie. Euro bailout bonds) and has promised to buy more.
II) For those interested in considering an investment in Japanese equities, here is a graph of the two biggest Japanese stock ETFs (mentioned earlier) compared to the Nikkei 225 Index.
In the graph to the left, the solid blue graph shows the price of the Wisdom Tree Japan HEDGED Fund (DXJ); the red line is the Nikkei Index; the green line is the iShares MSCI Japan
Note the obvious out performance by DXJ compared to EWJ. The difference is accounted for by the fact that DXJ “hedges” its exposure to the Yen; EWJ does not hedge. The fund you choose will likely be determined by whether you think the Yen will continue to weaken vis-a-vis the U.S. Dollar.
(DISCLOSURE: the author demonstrated his empathic capacity by holding bull put spreads in DXJ this past week. He also made the mistake of a carrying bull put spread in FXI (a Chinese Index ETF) and a bull put spread in HBC. I can verify first hand that Japan was not the only Asian market to be rocked by selling pressure this past week; and of course, HBC has a strong Asian presence. I have definitely had better weeks!)
Submitted by Thomas Petty MBA CFP
Related Posts
Also on Market Tamer…
Follow Us on Facebook

 Should You Buy Tractor Supply Stock Right Now?


