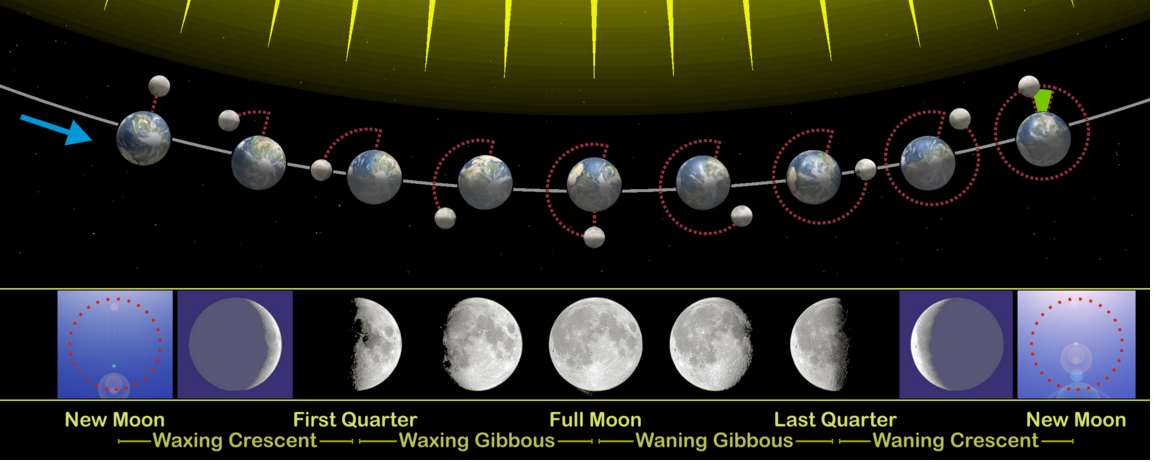
Much as the Moon moves through "Phases" and Nature moves through "Seasons", so do the Investment Markets move through "Cycles" -- ranging between "Bullish" and "Bearish" and everything in between.Much as the Moon moves through "Phases" and Nature moves through "Seasons", so do the Investment Markets move through "Cycles" -- ranging between "Bullish" and "Bearish" and everything in between.
I know our readers have become accustomed to quite detailed articles on one particular topic. However, when I recently ran across several images that convey a wealth of information in one (long) glance, I decided that sharing those with you could quite possibly be helpful to you[1].
As we move through these topics, we’ll cover some territory that begs for a “Trivia Contest” as well, namely[2]:
1) One huge U.S. company (within the “Top Ten Largest Companies in the World”, per market cap) has a higher credit rating than the United States government? What is its name?
2) What is the name of the largest U.S. financial services company (per market cap)?
3) Can you identify the “Fastest Growing Multi-Billion IT Enterprise In the World”?
4) Which company exceeded the $250 billion market cap milestone in the shortest time (from the date of its IPO)?
5) What is the world’s largest “sovereign wealth fund”… and how much money does it manage?
I) CORPORATE CYCLES
Can you name the ten largest corporations in the world (per market capitalization)?
Can you accurately estimate how many of the world’s companies with a market cap that exceeds $100 billion are domiciled in the United States?[3]
Here is a quick look at the current breakdown of the largest global companies (Market Cap > $100 billion):
|
REGION (in which domiciled) |
NUMBER OF COMPANIES |
PERCENT OF GLOBAL MEGA CAPS (2015) |
| WORLD TOTAL |
73 |
100.0% |
| UNITED STATES |
44 |
60.3% |
| EUROPE |
16 |
21.9% |
| CHINA/HONG KONG |
10 |
13.7% |
This data is particularly significant when compared to the same data point back in October of 2007 (just before the world’s financial system was besieged by crisis):
|
REGION (in which domiciled) |
NUMBER OF COMPANIES |
PERCENT OF GLOBAL MEGA CAPS (2007) |
| WORLD TOTAL |
76 |
100.0% |
| UNITED STATES |
30 |
39.5% |
| EUROPE |
28 |
36.8% |
| CHINA/HONG KONG |
10 |
13.2% |
As you can see, at the present time, the United States has become truly dominant within the world of “mega cap” companies – as much as anything because of the powerful emergence of Apple (AAPL), Alphabet (GGOGL), Amazon (AMZN), and Facebook (FB).
Here is the breakout of the (current) ten largest companies in the world:
| COMPANY | MARKET CAP (Billions) | NOTE OF INTEREST |
| APPLE (AAPL) | $634 | Sept. report: Largest corp. profit ever recorded[4] |
| ALPHABET (GGOGL) | $505 | We formerly knew this as “Google” (GOOG) |
| MICROSOFT (MSFT) | $428 | At the height of the “tech bubble”, it was the world’s largest company. |
| EXXON MOBIL (XOM) | $334 | In 2007, it was the world’s largest firm |
| BERKSHIRE HATHAWAY (BRK.A) | $328 | Reflects the genius and timelessness of Warren Buffett |
| GENERAL ELECTRIC (GE) | $308 | Its origins go back to Thomas Edison |
| AMAZON (AMZN) | $301 | Gathered size and dominance with notoriously low margins |
| FACEBOOK (FB) | $293 | Has overcome an IPO that was a debacle |
| WELLS FARGO (WFC) | $281 | The largest U.S. mortgage company |
| JOHNSON & JOHNSON (JNJ) | $280 | Boasts a credit rating higher than the U.S.! |
Here are some interesting details regarding each company:
AAPL: Cash at the end of October was a mind-blowing $205 billion (almost $37/share). AAPL’s peak market cap (April) was $750 billion. Will it be the first to exceed the $1 trillion market cap?
GOOGL: It is still hard for many to adjust to Google’s new corporate name (Alphabet). Thia corporate restructuring facilitated the segregate the traditional “internet search and advertising” business (upon which GOOGL was based and grew to mammoth size) from its “Projects Businesses” – such as Life Sciences, Calico, driverless cars, Google Capital, Google Ventures, and its Google X[5]. The company’s cash balance is an impressive $72.8 billion.
MSFT: Back in 2000, MSFT was the world’s biggest company. After stagnating for a long time, its stock reached a 15-year high after an earnings report that exceeded expectations. It is in the midst of transitioning from traditional “purchase/install” software to cloud-based products/services (Azure, Office 365, Windows 10, etc.).
XOM: In October of 2007 (on the cusp of the “Mortgage Crisis”), XOM was the world’s largest company ($510 billion). Since then, it has declined 30%. Obviously, the biggest driver has been the huge (>60%) decline in crude oil prices since June of 2014. For the 3rd Q of this year, XOM reported a 50% decline in net income (Year Over Year/YOY) and a 37% drop in revenue (YOY).
BRK.A: Warren Buffett’s iconic company reported record profits for its fiscal 3rd Quarter – totaling almost $9.5 billion. However, that total was driven by a one-time gain from the complicated merger (it took place in stages over 2.5 years) of Heinz and Kraft Foods (creating Kraft Heinz (HNC). [See: https://www.markettamer.com/blog/becoming-buffetted-about-by-twitter.]
AMZN: the stock reached an all-time high this month (December)… surging well over 100% on the year this far. In fact, it has surged over six-fold since 2009. ![]()
One of the drivers of this price move has been greater transparency with regard to its “Amazon Web Services” division – which reported a revenue increase of 78% for the 3rd Q (compared with the prior 3rd Q) … and totaling $2 billion (becoming, per Jeff Bezos, the “Fastest Growing Multi-Billion IT Enterprise In the World”.

GE: the corporate (historical) roots of GE extend all the way back to Thomas Edison and 1875.[6] After years of being in a trading range, GE rose to a 7 year high in November (and earnings ”beat”). Although it had been involved in major ways within the “Finance” space, in recent years it has been unloading its finance subsidiaries and acquiring manufacturing operations.[7]
FB: Facebook has overcome its embarrassing IPO debacle in May of 2012. In fact, it has earned the distinction of reaching the $250 billion market cap milestone in less time (3.5 years) than any other corporation in history! The higher than expected revenue reported during the 3rd Q ($4.5 billion) resulted in FB being driven to an all-time high in December.[8]
WFC: Within the U.S. finance world, WFC may be the “Stealth” corporation. If the U.S. citizens were quizzed regarding which company is the “biggest finance company in the U.S. – the likely answers would center on Chase Bank (JPM), Bank of America (BAC), Citigroup (C), Goldman Sachs (GS), etc. All of those answers are wrong! San Francisco-based WFC became the largest U.S. mortgage provider back in 2008, when it acquired Wachovia Corp. ($15 billion). The bank’s stock reached a record high in July, but has tailed downward by about 5% since then.
JNJ: Notice that JNJ is the only “health-care” firm in this elite “Top Ten” category. I suspect that most U.S. citizens would be stumped as well if asked which U.S. health-care firm is the “biggest”. JNJ reached an all-time high about a year ago, but has pulled back since then. Perhaps most surprising of all, JNJ is one of a small handful of U.S. industrial firms which has received a “Triple A” credit rating from both Standard & Poor’s and Moody’s.
Should we get accustomed to the United States thoroughly dominating the world of global “mega-corporations”?
I regret to say: “Probably not!” But before you take keyboard in hand and compose an angry tweet (or transmit an outraged email) decrying my lack of “patriotism”, consider these points:
1) U.S. Equity Outperformance: During the past 5 year and 2 year periods, the U.S. equity market (such as the S&P 500 Index) has outpaced the markets within the rest of the “Developed World” as illustrated below:
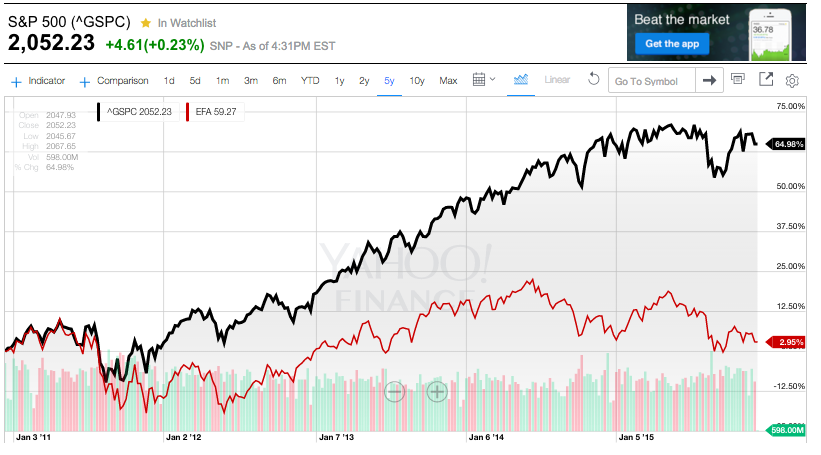
During the past 5 Years, the iShares MSCI EAFE Index Fund (EFA) has underperformed the S&P 500 Index by a dramatic 2.96% versus 64.98%!

During the most recent 2-Year period, EFA has underperformed the S&P 500 Index by -7.5% to +15.59%
The investment principle of “Reversion to the Mean” suggests that (eventually) this disparity will be reversed.
2) The U.S. Dollar has dominated the currency markets.
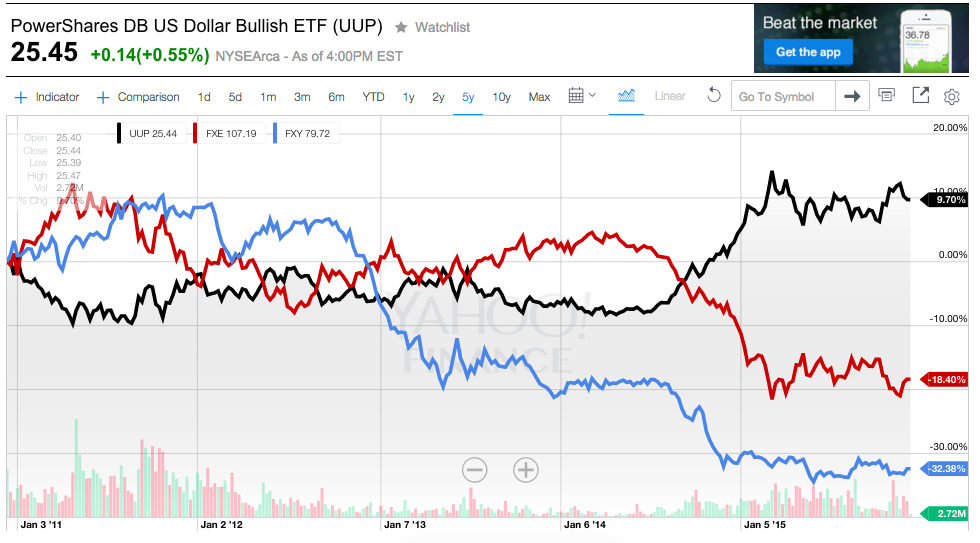
During the past 5-Year period, the US Dollar appreciated by 9.7%; while the EURO has depreciated by18.4% and the Yen by 32.38%.
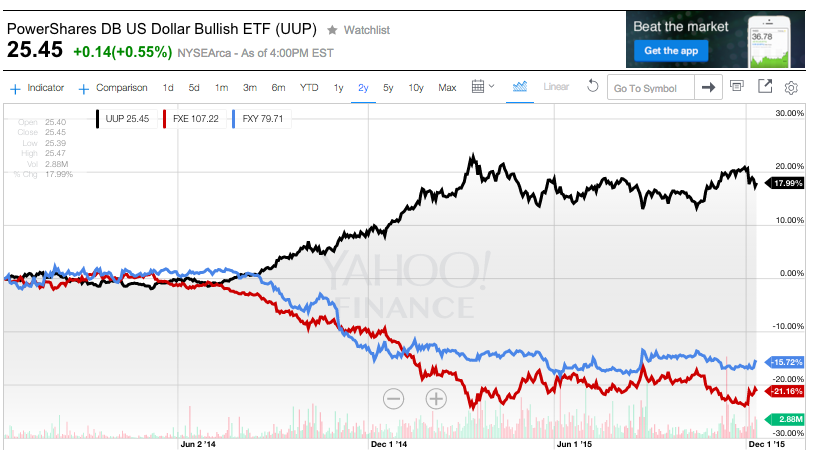
During the past 2-Years, the Dollar has moved up by almost 18%; while the Yen depreciated by 15.7% and the EURO by over 21%!
3) The Psychological Premium attributed to U.S. stocks — due to the general global perception that, although hardly “perfect”, the U.S. markets are the most liquid and (relatively) secure in the world.
The most obvious (and accessible) way to discern the extent to which U.S. companies (on average) receive a “premium valuation” vis-à-vis the average non-U.S. company is by comparing corporate Price/Earnings Ratios (P/E). However, as you will discover if you delve deeply into the mechanics and history of the P/E ratio, a better measure of relative valuation is Robert Shiller’s “Cyclically Adjusted Price-to-Earnings Ratio” (commonly referred to as CAPE, Shiller P/E, or P/E 10 ratio):
“is a valuation measure usually applied to the US S&P 500 equity market. It is defined as price divided by the average of ten years of earnings (Moving average), adjusted for inflation.” [See: https://www.markettamer.com/blog/how-to-cope-with-cape-fear-a-look-at-valuation-and-volatility

The point of reviewing this data is to assess “Relative Value”. In a world within which everything except stock price and corporate earnings is somehow “equivalent”[9], it is obvious that, over the course of the next five to ten years, an investor would be most likely to “outperform” by buying good stocks in Russia, Brazil, Poland, Peru, Turkey, or Portugal – all of which are “cheaper” on a relative basis than comparable stocks in Ireland, Japan, the United States, the Philippines, or Sweden.
However, quite frankly, I don’t currently have the stomach to invest in Russia, Brazil, Poland, Peru, Turkey, or Portugal! I perceive them as too unsettled and “risky”. And that is precisely why I will never be as successful an investor as Warren Buffett – who often quotes Baron Rothschild’s dictum regarding “value investing”: “The time to buy is when there's blood in the streets.”[10]
4) Markets Move in Cycles: It may not seem obvious on the surface, but the facts of which I remind us below are “corollaries” to points 1) and 2) above. To oversimplify, I compare the following to the age-old proverb: “Every dog has its day!”
a) JAPAN
Consider this chart from October of 1987 through December of 1989:
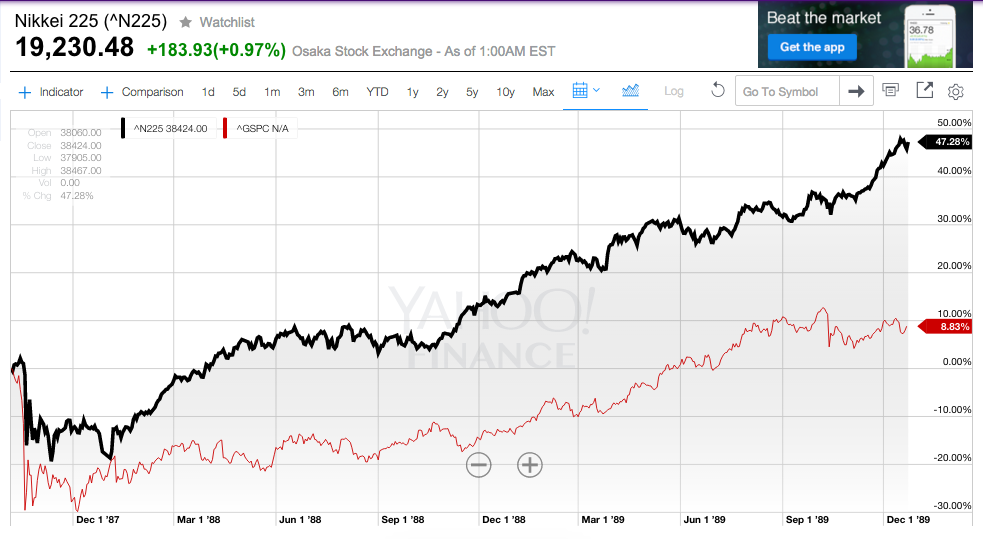
Between October of 1987 and December of 1989, the Nikkei 225 moved up by over 47%, while the S&P 500 managed just an 8.8% gain.
Our younger readers will have no recollection of the following, but the fact is that, in the late 1980’s, Japan dominated the rolls of the “biggest and best” global corporations. Japan’s dominance was so palpable that many experts (in typical media hyperbole) wrote about the Japanese economy and its huge corporate entities were (virtually) on an inexorable path toward long-term world dominance.
What has happened since then includes:
- A convergence of economic change, major demographic transformation (an extended period of national aging and related diminishment of the labor force, among other factors.[11]
- The result has been what we see today – a once dominant nation that is struggling to recover from “lost decades” of sub-standard economic growth, and saddled with a national debt that exceeds 230% of its GDP.

The growth of Japan's national debt since 1981.
b) EUROPE
For its part, Europe’s day came in the years that led up to 2007! When the world’s equity markets reached its (then) peak in October of 2007, Europe was (relatively speaking) “riding high”. In fact, Europe boasted 28 corporations with a market cap exceeding $100 billion! Yes, the U.S. had 30 companies in that “mega cap” category, but only two more than Europe had at the time!
One symptom of what changed for Europe can be seen in these two graphs:
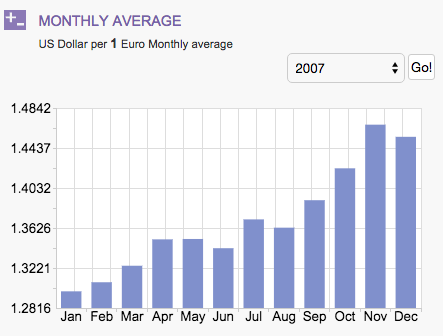
This is a graph of the EURO/U.S. DOLLAR currency pair in 2007. Note the rising value of the Euro vis-a-vis the Dollar!

Here is the same graph in today's market. Note the deterioration of the Euro compared with 2007!
Allow me to emphasize that I am not predicting that U.S. corporations (and the U.S. Dollar) will experience a “mighty fall” from their current “heights” within the next 7-15 years! No one can confidently predict such a change in economic dominance.
However, what I am cautioning is that no U.S. investor should ever “take for granted” the degree to which U.S. corporations (and economic strength) currently dominate the global scene.[12]
II) IS MORGAN STANLEY A “GRINCH”?
The prominent Wall Street firm, Morgan Stanley, recently released the results from a study it sponsored regarding both recent and prospective investment returns from the perspective of the “Efficient Frontier”.
Here is the graph the study generated:

From the Morgan Stanley "Efficient Frontier" Study
Here is the study's related commentary:
“The flatness of the [expected efficient] frontier means that the optimal portfolio will lie near the left-hand extreme of the redline for a variety of investor utility functions.” [Note the blue square, the green pyramid, the orange triangle on the “Efficient Frontier” curve for each investment period. Those spots on the curve indicate the asset mix that offered (or prospectively offers) the best “Risk Adjusted” return!]
One implication of this (prospectively) lower expected “optimized” return[13] is that an “Efficient” portfolio will include greater (than expected) exposure to credit:
“Relative to prior later-cycle periods, growth looks weaker, central bank policy looks lower, and credit risk premiums are more elevated.”
III) AN INTERESTING SCANDANAVIAN ASSET RE-BALANCING
As we have discussed often during the past few years, Central Bank monetary easing has dominated (and skewed) the financial markets in truly unprecedented ways since former Fed Chair Benjamin Bernanke introduced “Quantitative Easing”.
As was recently reported in The Telegraph, the “smart money” is intent upon not finding themselves unprepared for the (seemingly inevitable) day when this massive monetary easing actually succeeds in re-igniting inflation[14]. Symptomatic of this dynamic is the following:
This is the website logo for information about the Norwegian “Government Pension Fund Global” .
The world’s largest sovereign wealth fund is the Norwegian Pension Fund.[15] Fund managers have been systematically rotating funds out of financial assets and into real estate investments in London, Paris, Berlin, New York, San Francisco… and more recently, Asia (Tokyo and East Asia). According to CEO Yngve Slyngstad[16]:

CEO Yngve Slyngstad
“Every real estate investment deal we do is funded by sales of government bonds”
This asset allocation adjustment by the “Government Pension Fund Global” reflects similar adjustments being made by other huge sovereign funds – that is, moving out of government bonds and into less over-valued assets. In the case of Mr. Slyngstad, the indication is that the fund’s “goal” is a 15% stake in real estate.
IV) WILL COMMODITIES EVER STOP FALLING?
This question is totally rhetorical. Of course commodities will eventually stop falling – after all, although interest rates in Europe can move below zero, commodity prices cannot!
Below, we can see how low the aggregate commodity index (compiled and reported by the International Monetary Fund (IMF)) has fallen this year… as low as during the depths of the “Financial Crisis”:

As the following graph demonstrates, commodity prices have fallen fairly steadily during 2015 – with a respite at mid-year.

However, during November, prices declined with a seeming vengeance:
1) During the month, for every one commodity that had a positive move, seven experienced a negative month.
2) The S&P GSCI (formerly the “Goldman Sachs Commodity Index”) has not experienced a November with 21 or more negative moves in its component commodities since 1970!
3) Year-to-date, this index is on pace to experience the fifth worst decline on record (since 1970).
4) It is noteworthy (and a bit surprising) that no single commodity has had (through November) its worst year ever. That is true despite these data points:
a) Two are down over 40%;
b) Seven are down more than 30%.
c) Highlights (actually “lowlights”) include these (through November)
Nickel -42.8%
Natural Gas -40.7%
Crude Oil -35.8%
Brent Crude -33.3%
Coffee -33.2%
Kansas Wheat -33.0%
Zinc -30.5%
Then, consider the following graph (from S&P Dow Jones Indices) that compares S&P GSCI Monthly Spot Prices and the S&P GSCI Monthly Total Return data since 1970.

Two particular insights are apparent from this chart:
1) Spot Prices are now at levels last seen in February of 2009;
2) However, the “Total Return Index” sits at a level last seen ten years earlier (June 1999)
During November and December, we have seen (and some have suffered) from the collateral impacts of tumbling commodity prices (particularly Oil, which roiled markets the week of December 7 through 11).
Among the many consequences of this secular bear market in commodities have been the following:
1) Strong headwinds impeding positive performance within equity markets that reflect a strong dependence upon resource stocks (such as Canada and Australia);
2) Very strong headwinds impacting the economy of “Emerging Market” nations in particular, which reflect a much stronger (relative) dependence upon commodity exports than do the economies of “Developed” nations. That is apparent in this graph:
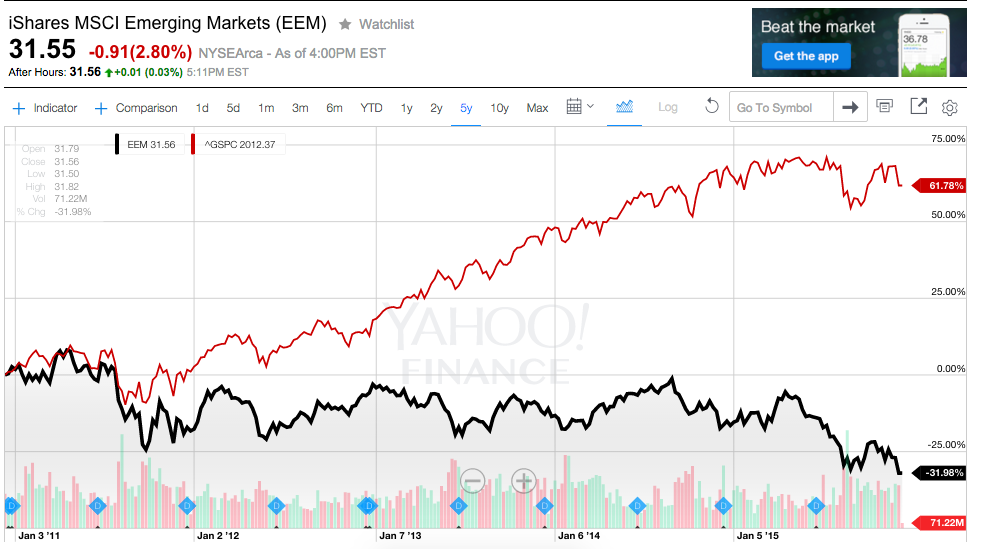
This 5-year chart of iShares MSCI Emerging Markets (EEM) (returning a negative 32%) and the S&P 500 Index (generating a positive 62% return) illustrates the degree to which the Commodity bear market and Central Bank intervention have hurt Emerging Markets!
3) In combination with U.S. Dollar strength, the bear market in commodities has resulted in greatly weakened currencies with the “Emerging Markets”.
4) The lack of any inflationary pressures from commodities has made the efforts by Central Banks to “jump start” their economies, commercial activity, and inflation largely fruitless.
However, since (as we have observed) there is a theoretical limit to how far down commodity prices can fall, at some point the strong secular bear trend will reverse… and become transformed into a secular bull trend. At that point, the “headwinds” alluded to above should turn into “tailwinds”.
INVESTOR TAKEAWAY
History shows that economies and markets move in “cycles”. Unfortunately for investors, human beings are wired to (generally) expect that current trends will continue into the future.[17]
Hopefully, you have gleaned some helpful insights by reading all that appears above, including (perhaps):
1) We should not expect U.S. corporations to be as dominant during the next 7-15 years as they have been since 2007!
2) We should not expect “average” investment returns to be as high during the next 5-7 years as they have been since March of 2009.
3) Many big institutional investment managers (such as the giant Norway pension fund) are preparing for a spike in inflation by selling government bonds and buying one or more inflation “hedges” (such as real estate).
4) At some point, the “Commodity Market” will switch from its current secular bear trend to a secular bull trend… (a point clearly related to point 3) above).
DISCLOSURE:
The author has held positions in virtually all of the “Top Ten” corporations listed above. The author has no relationship to Morgan Stanley or the Norwegian Pension Fund. Nothing in this article is intended as a recommendation to buy or sell anything. Always consult with your financial advisor regarding changes in your portfolio – either subtractions or additions.
FOOTNOTES:
[1] And at a minimum, will likely prove to be interesting as well!!
[2] You’ll find the answers within the article below
[3] I say “domiciled” in the U.S. because all of these mega-caps have overseas operations and income. In fact, they would not be a major mega-cap if they were not truly “global”!
[4] AAPL annual profit (year ended Sept 28, 2015) was $53.4 billion, surpassing the prior record of $45.2 billion in 2008 (by XOM)
[5] Allow the theme for “The X Files” to course through your brain. Google X is a secretive lab.
[6] Lest you think that makes GE is oldest among these mega companies… you would (from one perspective) be incorrect. Technically, XOM was “born in the 1999 merger of Exxon and Mobil. However, the historical roots of these companies trace back to robber baron John D. Rockefeller. Rockefeller’s monopoly, Standard Oil, was established in 1870. In 1911, the U.S. Supreme Court ruled that Standard Oil had to be dissolved – splitting it into 34 companies. Two of those 34 (eventually) became Exxon and Mobil.
[7] This may seem odd if one does not remember that “GE Capital” became a huge headache during and after the Mortgage/Financial Crisis. Therefore, GE has finally sold its GE Capital division and split off its consumer finance business (Synchrony Financial (SYF)). ![]()
[8] Monthly users increased by 14% (to 1.55 billion) and mobile-ad revenue increased as well.
[9] A world, le me hasten to add, that does not exist and will never exist!
[10] Rothschild was an 18th Century British nobleman who belonged to the famous Rothschild banking family. Among his claims to fame, he made a fortune by buying during the panic that followed the Battle of Waterloo against Napoleon.
[11] Factors that included failed government policies.
[12] That being said, I confess that it is difficult to foresee which country could soon replace the U.S. with regard to dominance. The natural choice for that role would be China. However, the more one delves into the “economic weeds” and the questionable credibility of governmental and corporate reporting in China, one will naturally begin to qualify any prediction that China is a “sure thing” as the next global economic superpower.
[13] The point of the “Efficient Frontier” (discussed in a number of prior articles) is to plot the point at which “Risk” and “Reward” are optimally balanced to improve the likelihood that investors will earn the highest “Risk Adjusted” return! We discussed related issues in past articles such as: https://www.markettamer.com/blog/sharpen-your-analysis-of-ibb-xbi-and-fbt and https://www.markettamer.com/blog/key-information-ratio-for-deciding-between-fcntx-and-rgaax
[14] Some expect inflation, when it comes, as being a bit like a tsunami – given the massive buildup over the past few years in global money supply.
[16] He is CEO of the Norges Bank Investment Management (NBIM) – which organizationally is part of the Norway Central Bank – specifically charged with managing the pension fund.
[17] That is why millions of investors buy “last year’s winners”… when in point of fact, history shows that many of this coming year’s “winners” will be last year’s “losers”.
Related Posts
 Is Kroger a Stock to Recession-Proof Your Portfolio?
Also on Market Tamer…


Follow Us on Facebook