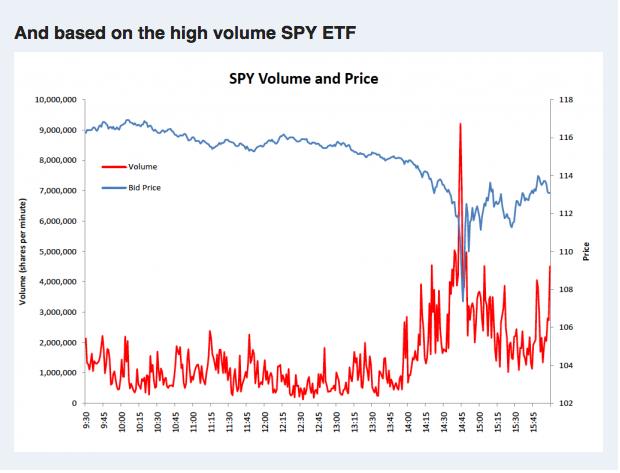
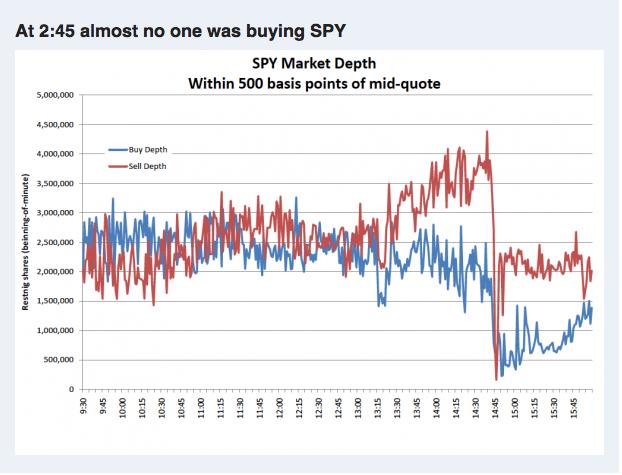
In Part I, we travelled back in time to May 6, 2010 – the day of the much studied and debated “Flash Crash”. That is a day that investors and professional fund managers/traders will never forget. Around 2:42 PM that afternoon, with the Dow Jones Industrial Index already down over 300 points (due to concerns related to Greek debt, and general market fear), the DJI suddenly did a free fall, losing an additional 600 points within five minutes. Two graphs from the “Flash Crash” report are particularly telling:
This graph of SPY shows the impact on price of share volume suddenly spiking far beyond market capacity in mid afternoon on May 6, 2010.
Complimenting the above graph, here is a second graph showing just how dramatically “buy” volume depth disappeared in the 15 minute window of the “Flash Crash”.
It would be comforting to believe that U.S. regulators and the various securities exchanges have thoroughly dissected and analyzed the variables from May 6th which led to the precipitous drop in the stock market between 2:42 PM and 2:47 PM (dropping the share price of some strong and well-established companies toward a penny) and have made systemic corrections to market mechanisms that are adequate to prevent any recurrence. It would be comforting – but it wouldn’t be true! The fact is that, although the market as a whole has not suffered a flash crash since then, innumerable individual stock issues have endured a very similar phenomenon.
Here is a sampling of the stocks that have been subjected to a “mini flash crash”. This sampling is in no way comprehensive, but hopefully what follows is sufficient to paint a clear and illustrative picture for you regarding market volatility:
1) The BATS Exchange IPO that was initiated on Friday, March 23, 2012,became so quickly and completely enmeshed within a maelstrom of technological glitches that the $16 offering price tumbled (for at least a bit) to as low as one penny. In the midst of a “flash crash” of its own, the underwriter pulled the IPO from the market. (see http://www.reuters.com/article/2012/03/24/us-bats-trading-idUSBRE82M0W020120324)
2) Apple (AAPL) shares experienced a mini-crash on January 25th of this year. During the final minute of trade, one million shares were executed – ten times the volume at any other moment that day – tumbling the stock by 2% and resulting in the (temporary) loss of $7 billion in AAPL market cap. Granted, AAPL had earlier reported disappointing earnings; but such an aberration shakes market confidence. (See http://www.zerohedge.com/news/2013-01-25/apples-flash-dump-last-second-trading-caught-tape). AAPL also saw a “mini flash crash” at 10:57 AM on March 23, 2012 (the same day as the BATS Exchange IPO) – plunging its price downward by 9%.
3) U.S. Silica Holdings (SLCA) experienced an “elevator drop” move on Valentine’s Day of this year – when its shares plunged 9% in less than two seconds. During the one minute period including those two seconds, 200,000 shares were traded, about 100 times the volume during any other minute that day. (It recovered within minutes; see http://0-money.cnn.com.library.ccbcmd.edu/2013/03/20/investing/mini-flash-crash/index.html).
There are a number of other instances of aberrant stock price behavior reminiscent of the May 2010 “Flash Crash” – brief periods of time during which a particular stock has dramatically tanked on heavy volume. Stocks included among that group are names such as Berkshire Hathaway (BRK-B), Home Depot (HD), Disney (DIS), Amgen (AMGN), Hanesbrands (HBI), AON PLC (AON), and the well-chronicled debacle which was the Facebook (FB) IPO (ten months ago on May 18, 2012).
Of an entirely different ilk, and yet resulting in similarly bizarre price action, was the “Knight Capital Debacle” on August 1, 2012 — another day I will never forget. That was the day Knight Capital, a huge executor of trades within the U.S., initiated trading on new (improved) software. Very unfortunately, as all later discovered, the program was improperly installed – resulting in wild price action within numerous stock issues and leaving Knight with massive positions that it had to dump at a loss totaling over $460 million. They had to be rescued through an infusion of $400 million from various other firms. In particular, I’ll never forget the price action of Exelon (EXC), a huge utility holding company in which I owned common shares and options. Under normal market conditions, Exelon’s price moves fairly staidly; but on that morning, it jumped up and down like a yo-yo on an extremely fast and erratic string. This particular incident is not a “flash crash” per se; but it is a powerful illustration of the risks inherent in machine driven trade infrastructure.
With regard to the market mechanism that FINRA is initiating on April 8th (the LULD Plan – for “Limit Up- Limit Down”) – the full detail is somewhat mind numbing. If you enjoy having your eyes glaze over, “Google” the full name of FINRA’s program (“Regulation NMS Plan to Address Extraordinary Market Volatility”) and make your choice of explanations offered from within the search options. To way over-simplify the pln, the various exchanges and FINRA-related trading firms will be responsible for calculating a range of prices for each stock or index (depending on price, market cap, etc.) that could be considered “normal”. Generally that range will fall somewhere within a band 5-10% from the immediately prior price. On and after April 8, stocks and indexes falling under the purview of Phase I (S&P 500 and Russell 500 issues as well as certain “Exchange Traded Products”: all lumped into a group referred to as “Tier I”) for which price falls outside the prescribed range will immediately have trade halted for 15 seconds. If order flow prices do not revert back into the prescribed range within that 15 second pause, then trading will be halted for 15 minutes, with the expectation that order flows will rectify themselves and revert back to acceptable levels.
Were I to create a Regulation NMS Plan to Address Extraordinary Market Volatility for Dummies book, I would create something similar to Bollinger Bands or Keltner Channels… but create them using the specs to be applied to the calculation of these “LULD” ranges. Then I would create several “case studies” of price action in SPY or AAPL (or some other well known stock) and create videos of “acceptable” price movement ranges. Then I would demonstrate various price movements (outside those ranges) that would prompt “LULD” Plan trading halts. Hopefully, this egregiously over-simplified summary will suffice for most of you. For all others, I highly recommend that you search for the “eyes glaze over” versions referred to above.
In upcoming pieces, I’ll walk you through a summary of the continuing (oft-heated) debate regarding the real cause of the “Flash Crash” in May of 2010. The parameters of that debate have significant impact upon the potential success or failure of “LULD”, as well as upon whether or not investors should be reassured by the initiation of these new risk-containment market mechanisms. One thing of which I can assure you is this: the evolution of the computer has infinitely increased access to economical and informed investing by the average investor. Back in the 1980’s, trading even a few options was extremely expensive unless you were a professional or had a very special rate. Now option trading is well within the grasp of the average investor – both in terms of access to trading data and in terms of affordable platforms within which to execute trades. However (and it is a huge “however”), this evolution of computerized trade execution has simultaneously made trading more intricately challenging and (at least at times) more inherently risky due to the continuing transition from human managed floor trading (the “open outcry” system) to computer dominated exchanges and order flow. It is in this context that we can all look forward to observing the impact of the “LULD” Plan in April and beyond!
Submitted by Thomas Petty
Related Posts
Also on Market Tamer…
Follow Us on Facebook


 Why Verve Therapeutics Is Skyrocketing Today
