There are times when elements of the investment world intersect with the worlds of literature or philosophy/faith. The current proliferation of the “Index” concept within (primarily) ETFs and funds is a great case-in-point. Let me explain.
If some sort of “Sleepy Hollow” event happened in your life, transporting you from the 1980’s or 1990’s straight into 2014, you would assume that all the ETFs that include the word “Index” in its name are “Passively Managed”… an investment approach particularly espoused by the founder of Vanguard Funds Group, John Bogle.[1] You would also assume that “Actively Managed” funds – ie. a fund that intentionally and proactively makes portfolio choices that differentiate it from the S&P 500 Index (or some other major “benchmark” metric) – would not have the term “Index” in them.
Imagine your surprise then, when a well-intentioned colleague took you aside and whispered: “Things are not what they appear to be, nor are they otherwise.”[2] You’d inevitably give them a look of utter puzzlement, wondering what a Sutra has to do with modern investing, at which point your friend would patiently explain that the investment world was (figuratively) stood on its head during the “Lost Decade”[3] – when the 10 year return on the S&P 500 Index (without dividends) was essentially flat! Financial giants, investment managers, exchanges, brokerages … in fact, the entire investment eco-system… have been re-tooled to offer investment tools that manage both investment choices and market risk in new ways.
The Financial Crisis of 2007-09 was such a traumatic event that it led to a significant reshaping of investment options within the U.S.
The investment landscape now includes 1,600 Exchanged Traded Products (with over $1.9 trillion of invested assets)[4] , while (in contrast) only a handful of ETFs existed during the 1990’s[5]. As ETF development moved beyond the “standard” indices (S&P 500 or the Dow Jones Industrials), ETFs began to focus upon less well-known indices (such as the Russell), upon a country or region, or even upon an industry sector, etc.
However, the big new “wrinkle” that has dramatically changed the investing landscape is the development of countless new indices based upon the opinion of investment managers that she/he can design a portfolio that will outperform the S&P 500 Index. Before the “Lost Decade”, such a portfolio would be managed “Actively” — with the manager making portfolio changes throughout the year as deemed appropriate.[6] However, the new methodology for trying to ensure sustainable market outperformance is to create an “Index” – with specific criteria for security selection (and provision for regular rebalancing) that will optimize fund performance over time.
The focus of this article is one of these “new fangled” Index Funds: the Market Vectors® Wide Moat ETF (MOAT) [based on the Morningstar Wide Moat Focus Index]. MOAT was launched in 2012, and is predicated upon focusing investment dollars upon the top 20-21 “Ideas” as identified through the Index. To grossly over simplify the portfolio selection criteria, they are based upon financial strength[7], a sustainable “wide economic moat”[8], and “most undervalued” (relative to “Fair Value”).
Since we have (in this space during past months) chronicled MOAT’s investment philosophy, performance, and re-balancing process, some may wonder why we are highlighting it again. The reason is simple. Where else can you secure the analytical expertise of a top-flight investment firm such as Morningstar – on a quarterly basis, no less – without paying a subscription fee? Taking a quarterly look at the ETF’s website (http://vaneck.com/widemoat/?utm_source=yahoobing&utm_medium=cpc&utm_campaign=moat&utm_term=market%20vectors%20MOAT ) provides an updated list of securities in the portfolio[9], as well as an abundance of metrics and narrative concerning changes in Fair Value and/or analyst adjustments regarding company “Moat” Rankings.
Fortunately for us, MOAT completed its regular quarterly re-balance as of 6/14/14.
Before we share information regarding the stocks sold and the stocks purchased during the MOAT Rebalance, I should share some information that I gleaned from listening in on the Morningstar Wide Moat Index Conference Call for financial advisors that occurred on June 25th. The panelists from Morningstar offered a brief description of the structured, multi-discipline process through which the most attractively priced “Wide Moat” stocks are quantified, ranked, and chosen each three months throughout the year.
Ten of the most experienced Morningstar analysts meet two to three times every week[10] to hear “Moat Reports” from other Morningstar analysts regarding what are deemed to be the most timely and apropos stocks deserving of re-evaluation as a “Wide Moat” stock – based on the selection criteria referred to earlier. The most frequent changes in weightings (rankings) tend to be the result of stock price changes[11] and/or changes within the competitive market landscape that impact the strength of any holding’s “Moat”. It is also worth noting that the “universe” of potential MOAT stocks excludes: 1) limited partnerships; 2) any stock not traded on a U.S. exchange; and 3) ADR’s.
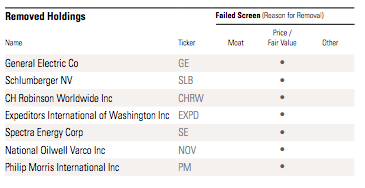
As I indicated earlier, the MOAT website provides us with an outstanding quarterly analysis of the relative value available through some top quality stocks! For example, here is a list of the seven stocks removed from MOAT because price moved up enough that “valuation” on these stocks is not as attractive (on a relative basis) as it is for some alternative outstanding companies.
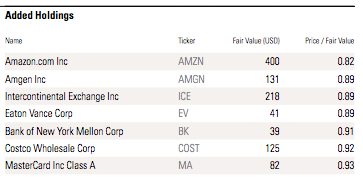
Next, here are the companies added to the portfolio as of June 14th:
The website provides the current Morningstar calculation of “Fair Value”, as well as where the price on 6/14 stood relative to that value!
The experts who spoke during the Conference Call offered these brief notes on each of the new additions to the MOAT portfolio:
AMAZON (AMZN) AMZN has one of strongest moats within the Morningstar Investment Universe!
It continues to expand and enhance the infrastructure that supports its 250 million customer base;
The new “Fire” product will increase its “network effect” by opening an additional channel through which to grow its customer base and push out more products/services.
AMZN continues to be disruptive within Retail, Digital Media, and the Cloud
Separately from the Conference Call, another Morningstar analyst (Michael Holt) raved about AMZN: “Forget about the phone. Amazon is so attractive because of its massive disruption in the retail space.[12] It’s their distribution model that gives them an advantage over their peers … Keep the faith; the profitability will take place. Spending money in international markets positions them for the future. In North America, they’re already seeing these margins … they need to take it to other countries.”
AMGEN (AMGN) The company’s high margin drug patents are a very strong suit
It continues to grow despite increasingly challenging reimbursement policies and competition
Two new drug products close to approval; it has a olid pipeline for growth
INTERCONTINENTAL EXCHANGE INC (ICE) Euronext IPO process now completed
The ICE moat is the huge scale of its existing institutional and retail client base.
Very difficult/costly to create a worthy competitor from the ground up.
There is also the “synergy” of its various revenue streams… including both the “Sales” side of the business and the “Clearing” side of the business. There is no immediate danger of ICE being required to separate the two.
There continues to be a “transition” within its business(es.
It has been under pressure… but it has learned to adapt!
EATON VANCE (EV) The primary moat factor for EV is its huge customer base, combined with customer satisfaction and significantly high “switching costs” that tend to result in customer retention.
Reputation is EV’s most important Intangible Asset;
The “Closed End Fund” market is a significant strength for EV;
It is well respected for the quality of its Asset Management services;
EV is especially recognized for its tax-managed funds!
BANK OF NY MELLON CORP (BK) BK is a unique “Asset Manager”;
It is the nation’s largest Asset Custodian;
The huge scale that resulted from the blending of the Bank of New York[13] with Mellon Financial serves to keep customer costs down. In turn, that makes “switching costs” higher for customers… leading to higher asset retention.
Of course, that latter point pertains particularly to the institutional market – which tends to be “stickier” than the retail market.

Costco (COST) is a major new addition to MOAT, following significance upgrades in analyst reports regarding the strength of its MOAT and an increase in its "Fair Value"!
COSTCO (COST) According to Morningstar, the moat rating on COST has recently rating been increasing… which is the primary current driver in its emergence into the MOAT portfolio.
Simultaneously, its “Fair Value” has recently been raised.
The COST business plan is to limit the number and variety of brands/models offered in the store, thereby managing inventory costs and affording them leverage in negotiating pricing with manufacturers.
It has been widely recognized for providing what it promises – ie. low prices; and that motivates customers to pay the annual “member” fee.
That stream of annual fee revenue is a prime driver of profitability.
The COST “model” is designed to push product through its system efficiently.
It’s supply chain and corporate infrastructure have proven successful.
An extra “kicker” is the very effective way COST leverages its gasoline retailing and auto supplies/repair as a “loss leader” to drive customer memberships and store traffic… something which (as noted by Morningstar) online retailers can not match!
MASTERCARD (MC) MC offers investors a very powerful “Network Effect”[14];
Over half of all revenue comes from overseas;
It does face regulatory threats… but that is nothing new.
One huge driver of future earnings is the accelerating pace of e-Tailing… which requires with e-Payments!!
THE PORTFOLIO:
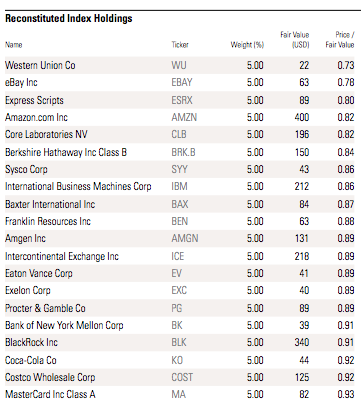
Given this rebalancing within MOAT, here is the current list of all securities in the portfolio!
And now for all of you who can’t help but “read ahead” in a novel to see if the character to whom you’ve become attached dies or lives… here is the list of the ten next most fairly priced “moaty” companies within the Morningstar investing universe. If you may feel especially strongly about one or more of these stocks, you may want to consider buying the stock (or selling a Bull Put spread) “ahead of the crowd”! [Note that this chart lists the “Fair Value” as of June 14th!]
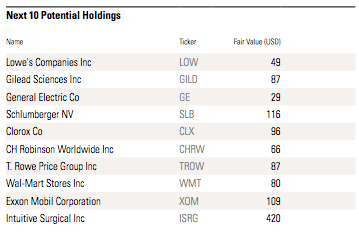
This is a list of MOAT stocks that "just missed" being included in the ETF during the June 14th Rebalance!
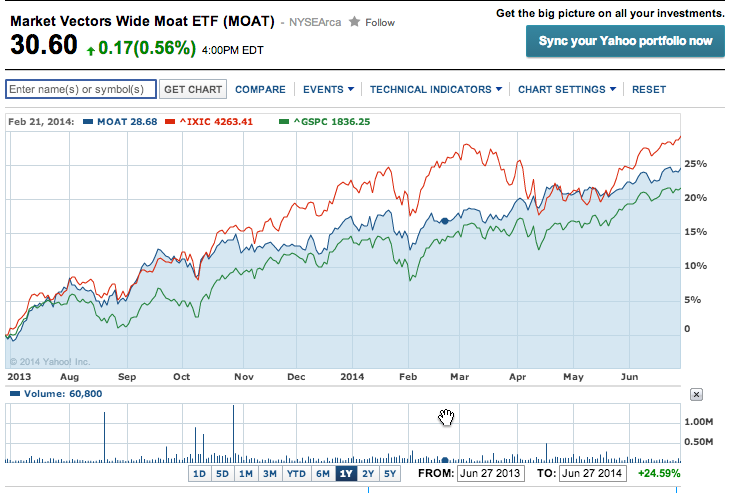
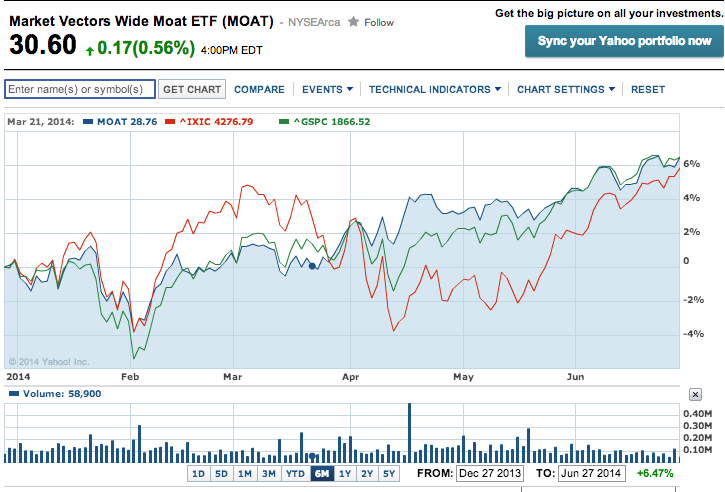
At this point, you may be wondering how MOAT performs vis-à-vis the S&P 500 Index. Therefore, here are some graphs to answer your question. [Note that MOAT was launched in April of 2012.]
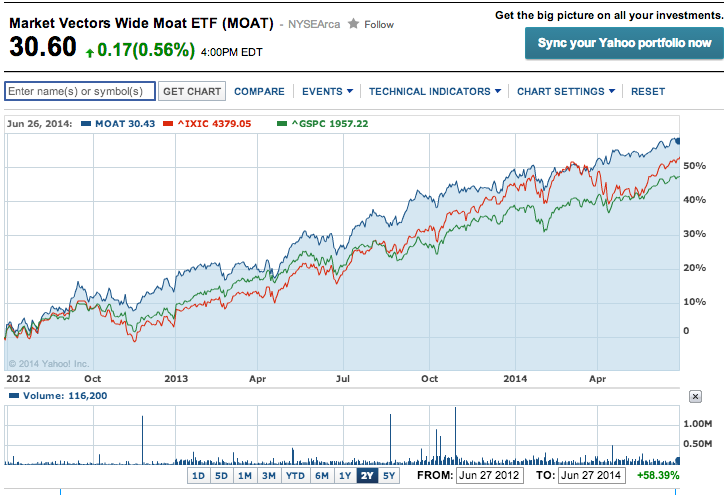
This graph shows MOAT's outperformance vis-a-vis the S&P 500 and NASDAQ over the past two year period.
As you can see, MOAT has outperformed the S&P 500 Index [and the NASDAQ, as well] throughout almost all of the most recent two-year period. In slight contrast, over the most recent one-year period, MOAT has outperformed the S&P 500 Index but not the NASDAQ. However, it should be obvious to all that MOAT has demonstrated much less volatility than the NASDAQ during the one-year period.
Based on the trailing six-month period, MOAT outperformed the NASDAQ and the S&P 500 Index.
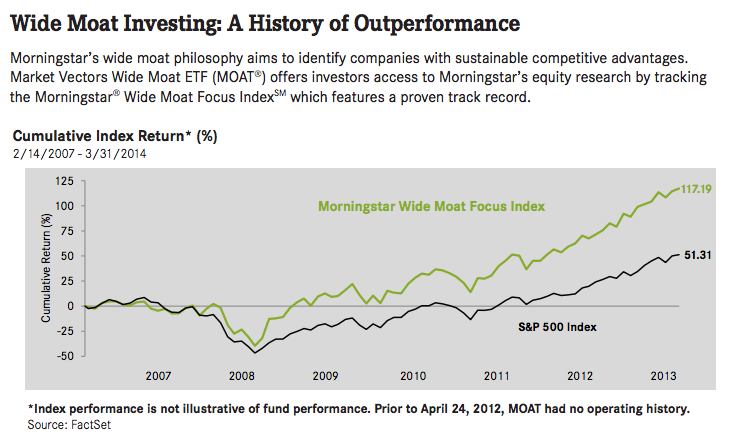
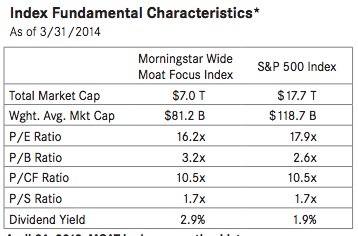
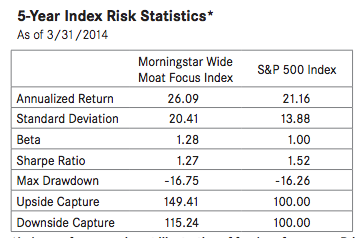
You can find more MOAT metrics and performance information in the APPENDIX (at the end).
There is one final data point that could be of interest to you. Paul Britt recently completed a study among a broad spectrum of U.S. “Large-Cap” and “Total Market” ETFs to measure their relative “Active Share”[15]
MOAT shows an active share of 92% — indicating a high degree of difference from its benchmark (it’s goal is to outperform the S&P 500). More to the point, of the twenty-four funds ranked by Britt, seven of them are described as “Actively Managed”. With an “Active Share” metric of 92%, Britt shows that MOAT ranks higher than all of the seven “Actively Managed” funds!
I’m sure you catch the significance of that metric! The Index-based MOAT ETF actually demonstrates more “Active Management” than funds that are identified as “Active”!! The irony of that fact confirms the point that I made at the very beginning of this article:
In this current era (which I identify as “Post Lost Decade”) investment firms are creating a growing number of indexes that each purport to result in an asset allocation that is superior to at least one major, commonly used equity benchmark! It is indeed a “New Wave” of investment opportunities that are available to investors today!
INVESTOR TAKEAWAYS:
If you don’t already make use of the tremendous investment resources provided (free) through the Market Vectors Wide Moat (MOAT) team (updated quarterly), I hope you will begin to do so soon!
You also may want to consider allocating a portion of your assets to an investment in MOAT. The MOAT team continues to apply impressive discipline throughout the year to ensure that their ETF reflects a solid portfolio of financially strong companies with extraordinarily competitive advantages that are priced below “Fair Value”!
It is well worth noting that, despite the quarterly rebalance process[16], the turnover costs of MOAT are well-controlled and the unique structure of ETFs has allowed MOAT to be managed through these first two years without any taxable capital gains being paid out to shareholders (despite the fact that, as you’ve seen, the performance of MOAT has been stellar).[17]
DISCLOSURE: The author has a buy order in place for MOAT. He has also owned (or currently owns) shares of companies that currently compose MOAT (AMZN, EXC, AMGN). Nothing in this article is intended as a recommendation to buy or sell anything. Always consult with your financial advisor regarding changes in your portfolio – either subtractions or additions.
THE APPENDIX:
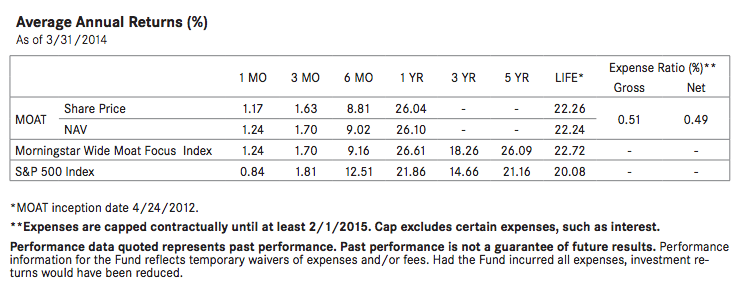
This data covers a 5 year period of performance on the WIDE MOAT INDEX. Remember that the MOAT ETF itself was not launched until April of 2012.
FOOTNOTES:
[1] Bogle espoused this on the basis that, overtime, Passive Index Funds provide performance that mirrors the general equity market, while simultaneously charging much lower management fees.
[2] A quote from Surangama Sutra; The quote is from a Mahayana Sutra that is one of the main texts used within the Chan School of Buddhism.
[3] The period between 2000 and 2010…which encompasses both the “Dot.com Bubble” and the “Mortgage Crisis Crash”.
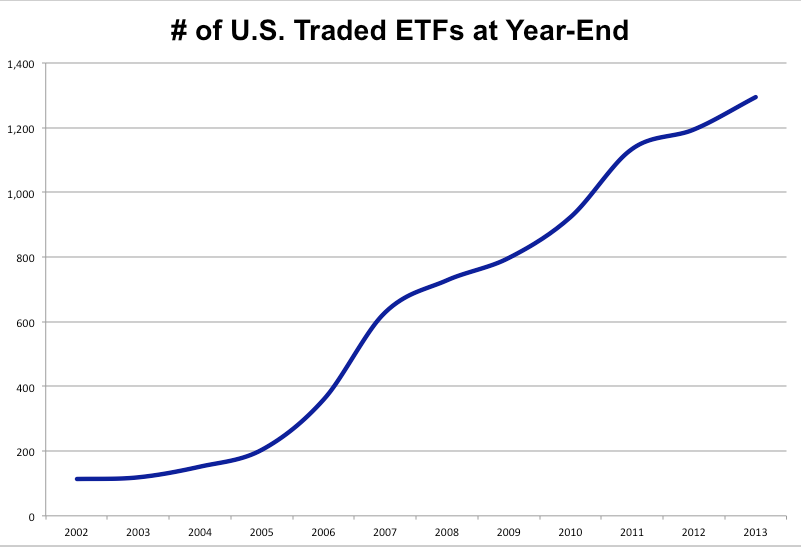
[4] That is according to a recent Charles Schwab report. Note that the category “Exchange Traded Products” includes much more than just “Exchange Traded Funds”. According to the “Investment Company Institute”, there were 1,294 Exchange Traded FUNDS traded in the U.S. at the end of 2013. See the graph in our APPENDIX … visualizing the GROWTH in ETFs since 2002!
[5] State Street Global Advisers introduced the first US ETF in 1993… the SPDR S&P 500 ETF Trust (SPY)
[6] As John Hussman used to say, that is portfolio management “the old-fashioned way”
[7] Morningstar requires that each holding produce a return on capital that is SUSTAINABLE and is greater than its “Cost of Capital”!
[8] For a brief video on the criteria used in measuring “Wide Moat” companies, take a look at the video on this page: http://vaneck.com/widemoat/?utm_source=yahoobing&utm_medium=cpc&utm_campaign=moat&utm_term=market%20vectors%20MOAT
[9] Identifying any/all stocks that have been sold, as well as those that replaced them (in the rebalancing process)
[10] Yes, every week. They take the process seriously.
[11] Facebook(FB) was a “Moat” stock within the past year, but appreciated so quickly that it became “overvalued” relative to other portfolio stocks and was sold!
[12] It was noted that AMZN’s $61 billion in revenue last year, he said, was equivalent to the next nine biggest retailers.
[13] The oldest U.S. bank… dating back to 1784!
[14] To put it succinctly, the more vendors it secures as MC users, the more appeal MC has for customers, and the more customers that use MC in stores, the more appealing MC is for vendors!
[15] The concept of “Active Share” was detailed by Antii Petajisto. It measures the overlap of holdings between a particular fund and its designated benchmark. A fund with a high “Active Share” means that the stocks it holds are significantly different than the benchmark.
[16] Which usually results in 6-7 stocks being replaced by other highly ranked moat stocks.
[17] ETFs can be created and redeemed via the delivery of “securities in kind” [instead of actually buying or selling said securities]. The IRS does not [yet] consider changes resulting from said “securities in kind” being received or delivered as a taxable event.
Related Posts
Also on Market Tamer…
Follow Us on Facebook

 Why Super Micro Computer Stock Is Soaring Today
