Our previous article about the performance of “Momentum ETFs” during the second half of August has increased awareness of (and interest in) these instruments. So let’s take a more detailed look at how “Momentum ETFs” came to be.
In days long gone by, the U.S. “stock market” was much less complex:
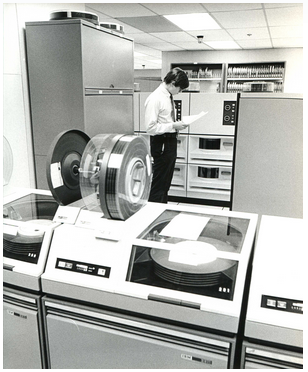
For those born less than forty years ago, this is what a standard "computer" looked like in 1970. They were programmed via punch cards and their size filled a room.
1) In the pre-Personal Computer Age of the post World War II era, stock trading by the “general public” was much less widespread:
a) Becoming well informed about promising stocks within which to invest was a challenge, requiring either a subscription service, visits to the public library, or depending strictly upon a broker to guide you[1];
b) There were no ETFs, and mutual funds were still in their infancy;
c) Most pension plans were “Defined Benefit” plans managed strictly by an employer (or its designee);
i) Therefore, 401(k) plans, etc. were as yet unknown;[2]
ii) Traditional IRAs did not yet exist.[3]
d) For investors who did trade stocks, transaction costs were, by our current “online trading” standards, exorbitant.[4]
2) The United States was the world’s dominant economic power following the war, and the U.S. securities market dwarfed those of the rest of the world.

An image of the New York Stock Exchange in days long gone by... when the U.S. markets dwarfed those of the rest of the world.
a) Any impact on U.S. stock prices from the economic metrics generated in other countries was minimal.
b) Try to imagine a market without daily hand-wringing over Greece or China news!
Here is a piece of obscure trivia that could make you a “hit” at your next cocktail party!
In those olden (golden) days of yore (1953) a man named Maurice Kendall[5] was the very first to examine the concept that fluctuations in the price of various stocks are independent of one another, so they therefore have the same probability distribution! (This theory also asserted that, over time, stock prices maintain an upward trend[6].)
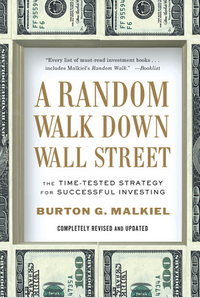
It was not until twenty years later (in 1973) that this theory became widely known. Dr. Burton Malkiel published his now well-known book, A Random Walk Down Wall Street. As evidence of its popularity through the years, the book is now in its twelfth printing.
To oversimplify Malkiel’s theory, here are bullet points that summarize his primary points:
- The past movement or direction of the price of a stock or the overall market cannot be used to predict its future movement.
- In other words, stocks take a random and unpredictable path.
- The chance of a stock's future price going up is the same as the chance it will go down.
- Therefore, it is impossible to outperform the market without assuming additional risk.
- In his book, Malkiel contended that both technical analysis and fundamental analysis were (for the most part) still unproven in outperforming the markets.
- Whenever a new study is published that demonstrates the failure of actively managed funds (on average) to outperform benchmark index averages (such as the S&P 500 Index), that study could be said to confirm Malkiel’s thesis.[7]
- Malkiel suggested that the best choice for investors is to adopt a “buy-and-hold” strategy, and investors should definitely not try to time the markets.
- It goes without saying that Malkiel has not been an authority trumpeted by Wall Street.
- It is worth noting, however, that Malkiel has long been associated with the Vanguard Group (a board member for 28 years at this investment company that Is widely acknowledged as the giant of index (passive) investing);
- More recently, Malkiel began serving as Chief Investment Officer to software-based financial advisor, Wealthfront, as well as an investment advisory board member for “Rebalance IRA”.
Without diminishing the value and enduring popularity of Dr. Malkiel’s work – work that was helpfully built upon
and expanded by such great minds as that of Dr. Eugene Fama (who was awarded the Nobel Prize in Economics in 2013) it should go without saying that the investment world within which we now live is exponentially more complex than was the case in either 1953 or 1973!!
To illustrate briefly, just consider my bullet points from the start of this article and (in essence) reverse them:
1) In the current post-Personal Computer Age (in fact, the “Mobile Computing Era”) stock trading by the “general public” has become much more prevalent:
a) Information about promising investment choices has become much more accessible and efficient through the vast resources available through the Internet (no more dependence upon a broker);
b) Not only are there thousands of mutual funds, but the availability and size of ETFs has exploded;
c) “Defined Contribution” benefit plans (through which U.S. beneficiaries have a much more direct stake within the U.S. securities markets) have become the dominant form of pension;
i) This includes 401(k) plans, 403(b)(7) plans, etc.
ii) Rollover IRAs and Roth IRAs have become widely owned.
d) Through online platforms, transaction costs have become a fraction of what those costs were between 1950 and 1990.
2) The world’s economic activity continues to become more globally interconnected and interdependent.
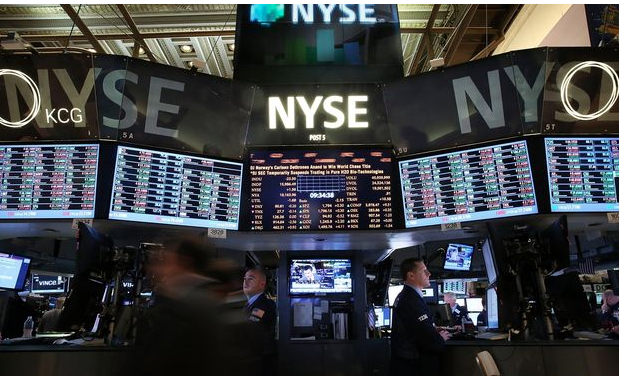
The fact that the NYSE is now a multi-continent business (NYSE Euronext) illustrates the globalization of today's investment markets.
a) China is now the world’s second biggest economy.
b) Securities markets there and throughout the world, including countless “Emerging Market” countries, have experienced burgeoning growth.
c) The volume of securities traded within the United States no longer accounts for more than 50% of all global activity.
d) The days when investors did not have to perpetually “worry” about international news items as Greek debt or slowing Chinese economic growth (or a crashing stock market) are long gone.
e) Perhaps most significantly, the U.S. (through Dr. Benjamin Bernanke) introduced the “Quantitative Easing” phenomenon … setting off what has become (almost pro forma) standard monetary policy around the world – filling the global economy with an unprecedented amount of money looking for a place to move.
i) That has made us even more interconnected with global economies and markets;
ii) Although they will not likely admit it, this also proscribes the range of actions that members of the Federal Reserve Open Market Committee can realistically consider at any given moment.
- Just one example is the recent kibitzing by the International Monetary Fund head, Christine Lagarde, when she publicly declared that the U.S. Federal Reserve should delay raising rates until 2016.
However, that being said, a more compelling reason to call into question some or all of Malkiel’s conclusions comes from credible studies that have demonstrated that past performance does have an appreciable impact on future price action within stocks – at least over the short to intermediate term.
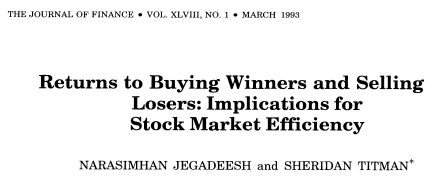
Ironically, one of the most important of these studies was published precisely 40 years after Kendall’s original work and 20 years after the first edition of Malkiel’s book: Returns to Buying Winners and Selling Losers: Implications for Stock Market Efficiency, authored by Dr. Narasimhan Jegadeesh[8] and Dr. Sheridan Titman[9]:
Here is an excerpt from an 2001 abstract of this significant work:
“There is substantial evidence that indicates that stocks that perform the best (worst) over a three- to 12-month period tend to continue to perform well (poorly) over the subsequent three to 12 months. Momentum trading strategies that exploit this phenomenon have been consistently profitable in the United States and in most developed markets. Similarly, stocks with high earnings momentum outperform stocks with low earnings momentum.”
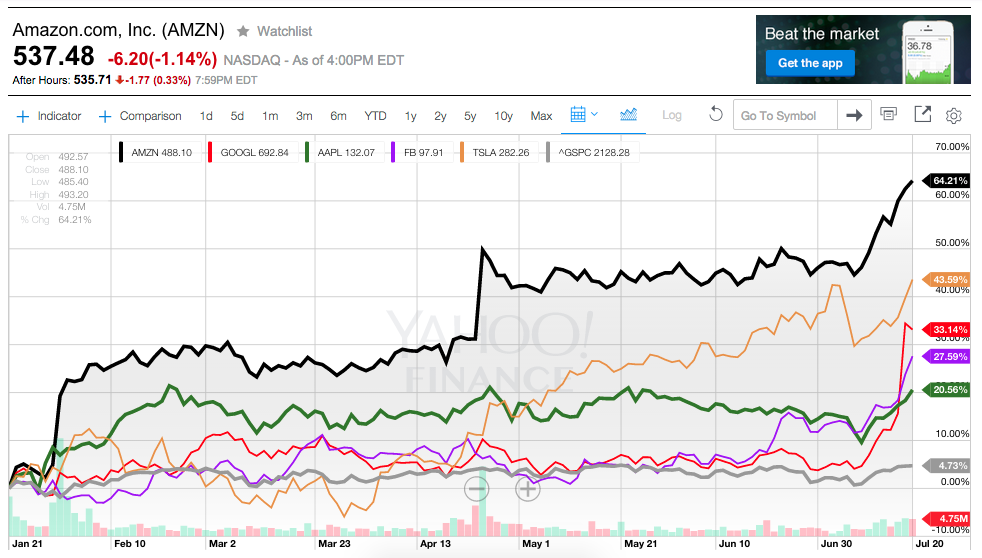
The disciplined research of Jegadeesh and Titman is what lends validity to the “Momentum Strategy”; but on an a priori basis, it makes sense that since investors are human beings (and not robots) the “buzz” that is generated by stocks that are either “high profile” or “glamour” stocks [such as Tesla (TSLA); Apple (AAPL); Amazon (AMZN); Google (GOOGL); or Facebook (FB)] often motivates great enthusiasm within the market, resulting in a greater volume of buying within such stocks rather than selling. As folks notice the growing “Relative Strength” of such stocks… even more money piles into them, and the price moves up even higher!
Just take a look at these stocks between January 20th and July 20th of this current year. Although the S&P 500 Index moved up just 4.73%, here is how some “high profile” stocks exhibited “Momentum”:
AMZN +64.21%
TSLA +43.59%
GOOGL +33.14%
FB +27.59
AAPL +20.56%
Professors Jegadeesh and Titman are not the only experts who have published studies regarding “Momentum”. The aggregate data processed and analyzed within these studies has established that, in almost all the markets studied (going back as long ago as two centuries) a positive “Momentum” effect has been discernible.
More specifically, a study from one of the industry leaders in this strategy (AQR Capital Management) discovered that within the U.S. markets between 1927 and 2010, the best momentum stocks outperformed the worst momentum stocks by an annual average of 10%. Obviously, investors seem drawn toward well-performing stocks (or highly touted stocks pre-IPO) – no matter how weak that stock’s fundamentals might be.[10]
These studies, combined with market experience, have prompted countless investment industry leaders to acknowledge the role of “Momentum” within portfolio design. For example, from the CIO at Gerstein Fisher, Gregg Fisher:
“Momentum can be an important contributor to the portfolio. Past prices do influence future prices.”
And Todd Rosenbluth, the Director of ETF/Mutual Fund Research at S&P Capital IQ, offers this very crucial point regarding “Momentum” stocks:
“… Stocks that are working will continue to work… [However] Stocks that are showing strong momentum can fall out of favor quickly.”
It is not challenging to remember examples of just how “quickly” such stocks can deteriorate:
- In mid-March of 2014 … previously high-flying Social Media & BioTech stocks tumbled;
- Following recent comments by a presidential candidate regarding exorbitant drug prices, BioTech stocks took another tumble; (in fact, just this week some of the BioTech ETFs fell almost 5%).
The result can be seen in what might otherwise be interpreted as unusual price performance over time within the “Momentum” space vis-à-vis “the Market”. For example:
- Two of the oldest momentum strategy funds (used almost exclusively by institutional investors because of a required minimum investment of $5 million)
AQR Large Cap Momentum Style I (AMOMX)
AQR Small Cap Momentum Style I (ASMOX)
… each fund trailed their Russell Benchmark Index during 2014, after a very positive final 6 months during 2013.
* The PowerShares DWA Momentum ETF (PDP) (one of the largest momentum ETFs) trailed the Russell 1000 Index during the three-year period ended 6/30/14… but outperformed the Index during the entire 5-year period
The key “take away” here is that timing and agility is a key factor that impacts the performance of ETFs (or funds) that utilize a “Momentum” strategy. Obviously, one’s first reaction to that fact might be to re-balance or adjust each portfolio frequently. And yet, doing that rather quickly leads to mounting trading costs and a higher net fund expense ratio.
On the other hand, while managing such an ETF utilizing a longer time frame does successfully diminish the performance impact of the market’s (inherent) day-to-day gyrations, confusion, “noise”, etc…. as well as reducing fund expenses … the consequence of a longer time frame is that the ETF could be left “holding the bag” on a stock that quickly falls very much “out of favor”.
An investment strategist at Blackrock (which offers the iShares MSCI USA Momentum Factor (MTUM)), Mark Carver, summarizes the time horizon/cost spectrum along which a fund manager must choose carefully in order to optimize performance [notice Carver refers to a “reasonable” time horizon… rather than either “long” nor “short”):
“Having a reasonable [time] horizon allows you to not turn over the portfolio nearly as much, to capture the intended trend, and not overreact.”
Research regarding a “Momentum” strategy has also yielded another fascinating insight. As most of you know, “standard” investment analysis has historically contrasted “Growth” stocks (or a “Growth Style”) with “Value” stocks (or a “Value Style”). In fact, the category “Blend” is understood to be an appropriate mixture of “Growth” and “Value”.
However, a number of studies have demonstrated that if one pairs “Momentum” stocks with “Value” stocks on a 50/50 basis, the resulting portfolio can generate improved “Risk-Adjusted” returns. [See https://www.markettamer.com/blog/key-information-ratio-for-deciding-between-fcntx-and-rgaax and/or https://www.markettamer.com/blog/sharpen-your-analysis-of-ibb-xbi-and-fbt to find more detail about “Risk-Adjusted” performance].
One specific example of such research was published in 2013 [“Value and Momentum Everywhere,” The Journal of Finance, vol. 68, no. 3, 929-985] authored by Cliff Asness (AQR Funds), Dr. Tobias Moskowitz (University of Chicago) and Dr. Lasse Pedersen (N.Y. University). This study presents detailed analysis of this premise regarding such a “hybrid” strategy. One of the conclusions of the authors is that because “Momentum” and “Value” are negatively correlated (complementing one another), an appropriate blend of these strategies will, over time, generate better risk-adjusted returns.[11]
If we were in school setting (Investment 101) and faced an important test question such as: “Explain why the combination of a Momentum Strategy and a Value Strategy makes sense…” what follows is an example of a cogent answer:
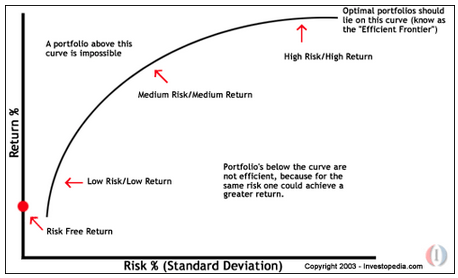
As the "Efficient Frontier" graph illustrates, combining strategies and/or asset classes is an effective way to enhance risk-adjusted returns!
We learn from ‘the Efficient Theory’ that pairing non-correlated (complementary) strategies can generate improved risk-adjusted returns. ‘Value’ strategies are built upon finding stocks with solid fundamental characteristics that are under-appreciated by investors. ‘Momentum” strategies are based upon measures of ‘Relative Strength’ (which often ignores fundamental details).
Data demonstrates that over a short to intermediate time period, strategies focused on momentum can shine… while (in contrast) over longer stretches of time, strategies centered upon fundamentals outperform the market as a whole. Therefore, combining these two strategies serves to ‘smooth out’ the aggregate monthly and quarterly returns of the portfolio, as well as enhance measures of risk-adjusted return!
Let’s review performance data on four typical “Momentum” ETF’s:
First Trust Dorsey Wright Focus 5 ETF (FV)
iShares MSCI USA Momentum Factor (MTUM)
PowerShares DWA Momentum ETF (PDP)
QuantShares US Market Neutral Momentum (MOM)
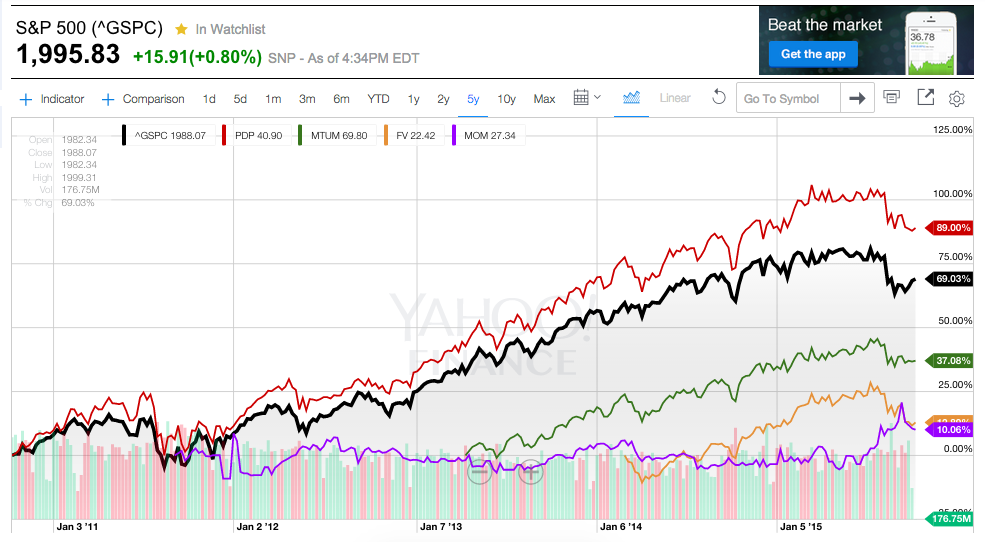
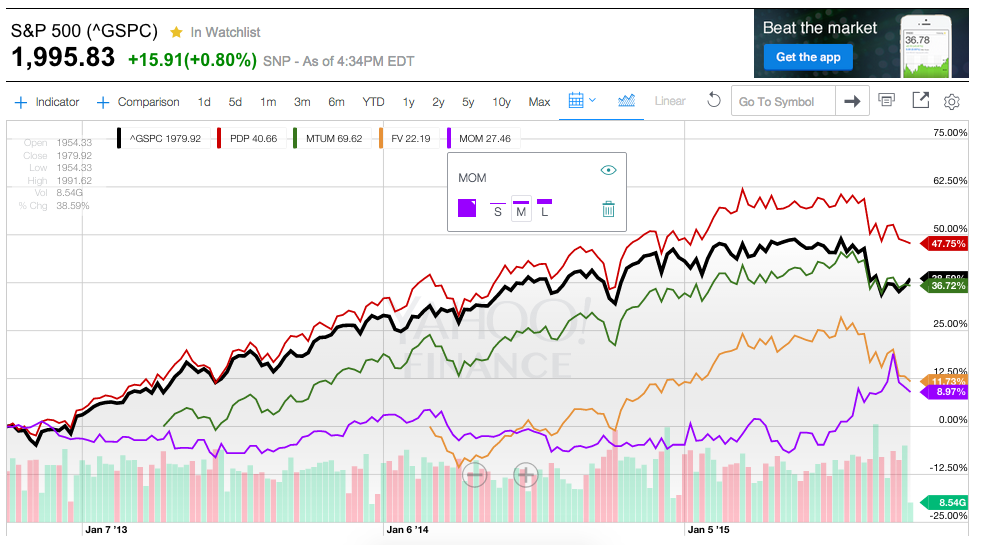
Here is a graph of the previous five-year period (through October 7, 2015)[12]:
PDP +89.00%
S&P 500 Index +69.03%
MTUM +37.08%
FV +12.89%
MOM +10.06%
The prior three-year period (through October 7, 2015):
PDP +47.75%
S&P 500 Index +38.59%
MTUM +36.72%
FV +11.73%
MOM + 8.97%
The prior two-year period (through October 7, 2015):
MTUM +31.72%
PDP +25.31%
S&P 500 Index +20.02%
FV +12.87%
MOM +11.59%
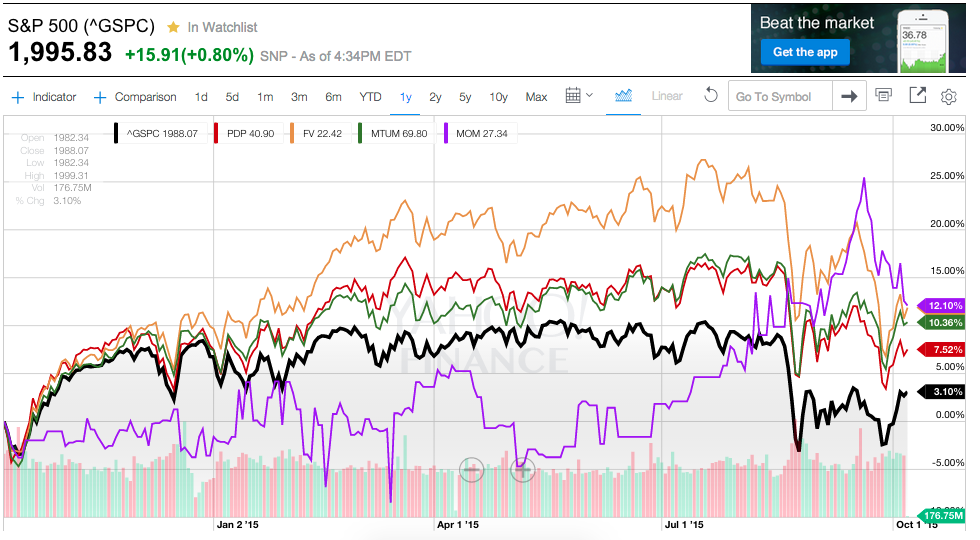
The prior one-year period (through October 7, 2015):
MOM +12.10%
FV +11.88%
MTUM +10.36%
PDP + 7.52%
S&P 500 Index + 3.10%
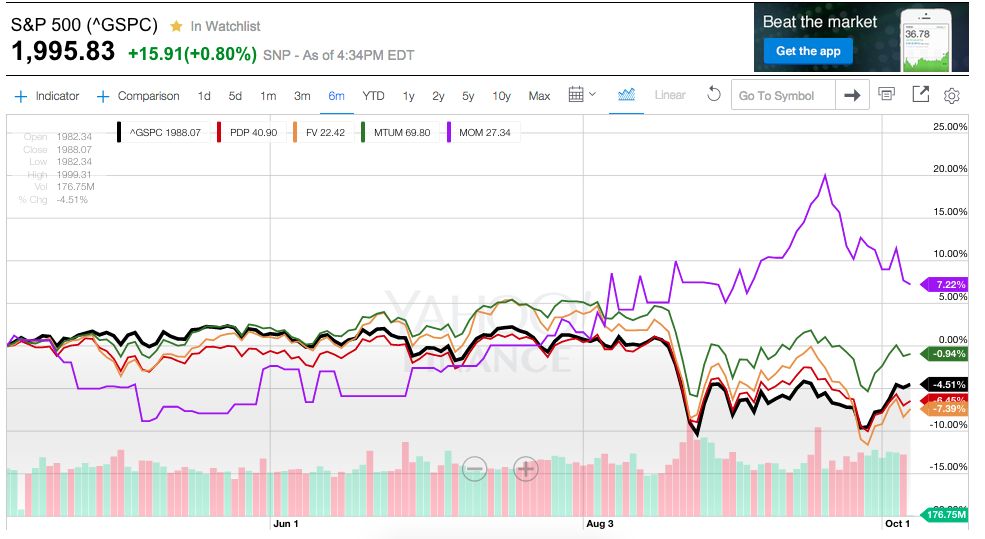
The prior six-month period (through October 7, 2015):
MOM + 7.22%
MTUM – 0.94%
S&P 500 Index – 4.51%
PDP – 6.45%
FV – 7.39%
Here are some very brief descriptions of each ETF… as well as the website at which you can uncover more detail as you desire:
PowerShares DWA Momentum Portfolio (PDP)
PDP is based on the Dorsey Wright Technical Leaders index[13] This ETF is rebalanced on a quarterly basis.
PDP is an older ETF in this space – rolled out in 2007. In March, it reported Assets Under Management (AUM) of $1.9 billion. Its “Expense Ratio” is 0.63%.
PDP’s top three sector weightings include:
Consumer Discretionary (33.2%)
Healthcare (15.72%) and
Industrials (14.3%).
Web: https://www.invesco.com/portal/site/us/investors/etfs/product-detail?productId=PDP
iShares MSCI USA Momentum Factor ETF (MTUM)
This ETF was rolled out in 2013.
From its webpage: “The iShares MSCI USA Momentum Factor ETF seeks to track the performance of an index that measures the performance of U.S. large- and mid-capitalization stocks exhibiting relatively higher momentum characteristics, before fees and expenses.”
It manages $870 million (AUM).
Expense Ratio: 0.15%
MTUM’s three top sector weightings include:
Consumer Discretionary (30.45%)
Information Technology (22.65%) and
Healthcare (19.81%)
WEB: https://www.ishares.com/us/products/251614/ishares-msci-usa-momentum-factor-etf
First Trust Dorsey Wright Focus 5 ETF (FV)
This ETF was launched in February of 2014.
From its webpage: “The Fund seeks investment results that correspond generally to the price and yield (before the Fund's fees and expenses) of an index called the Dorsey Wright Focus Five Index (the “Index”). The Fund will normally invest at least 90% of its net assets (plus the amount of any borrowings for investment purposes) in the exchange-traded funds (“ETFs”) that comprise the Index. First Trust will regularly monitor the Fund's tracking accuracy and will seek to maintain an appropriate correlation.”
It manages $4.070 billion (AUM).
Expense Ratio: 0.94%
FV’s top four investments (which also suggest sector weightings) include:
| First Trust NYSE Arca Biotechnology Index Fund | 23.42% |
| First Trust Dow Jones Internet Index Fund | 20.54% |
| First Trust Health Care AlphaDEX® Fund | 19.66% |
| First Trust Consumer Staples AlphaDEX® Fund | 18.72% |
| First Trust Consumer Discretionary AlphaDEX® Fund | 17.54% |
WEB: https://www.ftportfolios.com/retail/etf/etfsummary.aspx?Ticker=FV
QuantShares US Market Neutral Momentum (MOM)
For details about MOM, please review https://www.markettamer.com/blog/mom-performed-well-around-black-monday-despite-the-sec … in which we highlighted the ETF extensively.
WEB: http://www.quant-shares.com/etf-list/momentum-etf-mom/
INVESTOR TAKEAWAY:
The well-read and often quoted work of Dr. Burton Malkiel and Dr. Eugene Fama notwithstanding, a substantial body of research demonstrates the value of the “Momentum Strategy” within an investor’s diversified portfolio.
As we suggested in our narrative above, and as you could plainly see in the price performance graphs for these ETFs vis-à-vis the S&P 500 Index, “Momentum Strategy” ETFs can outperform the S&P 500 Index during certain extended stretches of time.
If you find yourself drawn to this strategy, you will need to discern which particular ETF most closely meets your risk tolerance and investment needs. Here are some basic observations that may assist you:
MTUM charges the lowest annual expenses;
PDP and FV are the “biggest” in terms of assets, so they are the most liquid.
PDP was the 5-year leader (by far); but that can be misleading, since three of the ETFs did not exist throughout that entire period.
The most “consistent” of these ETFs has been MTUM. It is the only one of the ETFs to appear within the top three (performance-wise) through all periods shown above.
As became apparent in our previous article, MOM has been the best performer over the one-year and six-month periods.
One final point is worthy of re-emphasis:
Although standard investment analysis usually contrasts “Growth” vs. “Value” funds and ETFs… recent research suggests that a potentially rewarding way of maximizing both the “Momentum Strategy” and the “Value Strategy” is to combine them into a 50%/50% portfolio that (over time) will generate returns that reflect quite favorable “Risk/Reward” characteristics.[14]
DISCLOSURE
The author holds positions in the S&P 500 Index, but does not yet own MOM, MTUM, FV, or PDP.
Nothing in this article is intended as a recommendation to buy or sell anything. Always consult with your financial advisor regarding changes in your portfolio – either subtractions or additions.
FOOTNOTES
[1] That third option was particularly risky, as we’ve learned in broker “memoirs” regarding how they often took advantage of customers.
[2] The Revenue Act of 1978 included a provision that became Internal Revenue Code (IRC) Sec. 401(k) (for
which the plans are named), under which employees are not taxed on the portion of income they elect to receive as deferred compensation rather than as direct cash payments. The Revenue Act of 1978 added permanent provisions to the IRC, sanctioning the use of salary reductions as a source of plan contributions. The law went into effect on Jan. 1, 1980. Regulations were issued in November of 1981.
[3] The tradition U.S. IRA was codified by the Employee Retirement Income Security Act of 1974 (ERISA).
[4] That is an understatement when one considers the inflation-adjusted value of commission/transaction costs then versus now!
[5] Kendall was a British statistician who developed the “Kendall Rank Correlation Coefficient” … or Kendall’s Tau Coefficient (referring to the Greek letter) – which is a statistic used to measure the association between two measured quantities.
[6]That is a tenet which millions of investors began to question in 2001 (“Dot.com Bubble”) and 2007-09 (“Financial Crisis”).
[7] However, there are countless studies that claim to establish the opposite premise… frequently referenced in the marketing material for active funds.
[8] The Dean's Distinguished Chair in Finance at the Goizueta Business School (Emory University)
[9] The McAllister Centennial Chair in Financial Services at the University of Texas
[10] We all know, for example, how many “hi-fliers” there have been in the market that demonstrated outperformance despite not yet having generated a dime of net profit!
[11] As suggested by studies related to the “Efficient Frontier”, combining negatively correlated assets can move a portfolio up along the Efficient Frontier graph, indicating improved risk-adjusted performance.
[12] Note that MOM was not rolled out until 2011; MTUM was not rolled out until 2013; FV was not rolled out until 2014.
[13] An index that selects 100 large- and mid-cap US stocks based on (for example) each stock’s performance relative to other stocks in the universe… as well as (in particular) others stocks in its industry sector (or industry sub-sector).
[14] Simply put, combining these strategies can result in enhanced risk-adjusted return!
Related Posts
Also on Market Tamer…
Follow Us on Facebook









 Move Over, Stock-Split Stocks: IPO Mania Is Taking Center Stage (and It's Probably Not Going to End Well)
