What can Plato tell us about the stock market? Yes, I am referring to “the” Plato, that intellectual giant from fifth century BC Greek history who was taught by Socrates and went on to found the first institution of higher education (the Academy of Athens) and generate writings that are widely considered the foundation of Western philosophy[1]. In addition, Plato’s most famous student was none other than Aristotle.
Take a look at this chart of the S&P 500 Index between the start of 2016 and February 10th. To provide contrast, I also show the iShares Barclays 20+ Yr Treas.Bond (TLT) ETF. While TLT moved upward by 9.3%, the S&P 500 fell by almost 8%:
This graph shows the relative price movement of bonds (TLT in red) and the S&P 500 Index between Jan 1st and Feb 10th of this year.
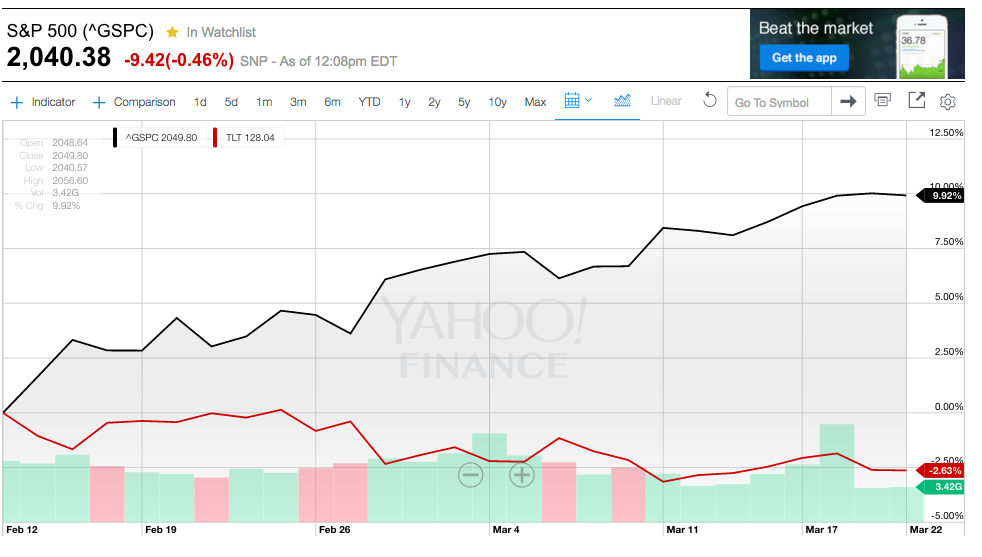
Following February 10th (as you know) the S&P 500 Index moved up over 9%, while TLT moved downward over 2.5%:

This graph shows the S&) 500 Index reversing its direction and significantly outperforming TLT between 2/10 and 3/22/16.
Since the beginning of 2016, as I kept up with commentaries about the market, I noted that the general “tone” grew decidedly more pessimistic as we moved through the second half of January and into the first half of February – particularly with regard to the Financials [see https://www.markettamer.com/blog/insights-about-a-poor-performing-sector ; https://www.markettamer.com/blog/coco-the-clown-and-the-markets ]
In fact, it was during this period that a growing number of observers expressed concern regarding just how much further equities might fall, since by then the S&P 500 Index had already fallen below a number of significant support levels.
Therefore, not only were investors barraged by a lot of talk about “Correction”… but all too many commentators (intentionally or unintentionally) sparked considerably more fear within investors by drawing dire parallels to market action in the 2008 – 2009 period. Things were looking quite bleak for stock investors!
But then, without the sound of trumpets or any audible command or alert … U.S. equities began a very impressive advance upward. U.S. equities jumped by almost 10% in just 28 trading days! That advance came despite widespread doubt that the S&P 500 could move above (on a sustainable basis) resistance at its 200-day moving average!
So the natural question over which investors are puzzling is: “What is going on?”

This is an enhanced version of the typical image of Plato — the ancient Greek intellectual and literary giant.
Ahhh…. That’s where Plato comes in.
In his work entitled “The Phaedrus”, Plato quotes the title character[2] as follows:
That is a quote that I suggest you print out and tape to your trading computer. Let it serve as a daily reminder that the complexities of the global securities markets are beyond the ken[3] of those of us who do not have the intellectual gifts of Plato or the prescience of a divine being!
As we look at the market action since February 10th (up over 9%, with fewer negative divergences when compared with the advance last year between mid-September and early December), one might deduce that the market was “strong”.
However, let’s take into consideration the wisdom of Phaedrus!
I pose for you three possible explanations for the advance between February 10th and March 21st (most recent high up to the writing of this article):
1) It was powered upward more by “Short Covering” than by true investor “conviction”;
2) Investors suddenly turned strongly positive on the market;
3) Something happened as “Earnings Season”[4] wrapped up to move the market upward.

Here is an image of how I like to imagine Plato if he appeared as a commentator on CNBC. I guarantee you he would be more enlightening (and forthright) than the “typical” expert appearing on financial shows today.
Let’s consider each of the above:
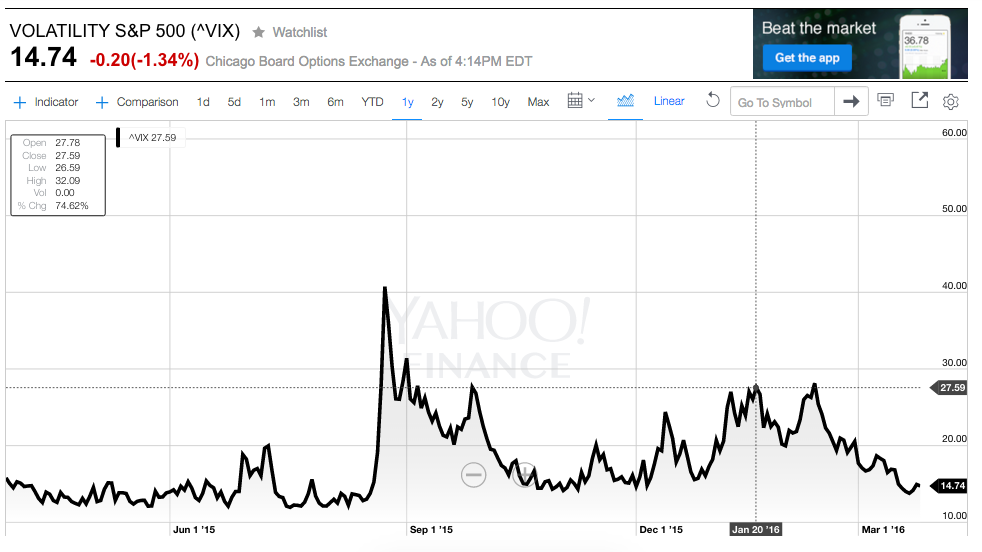
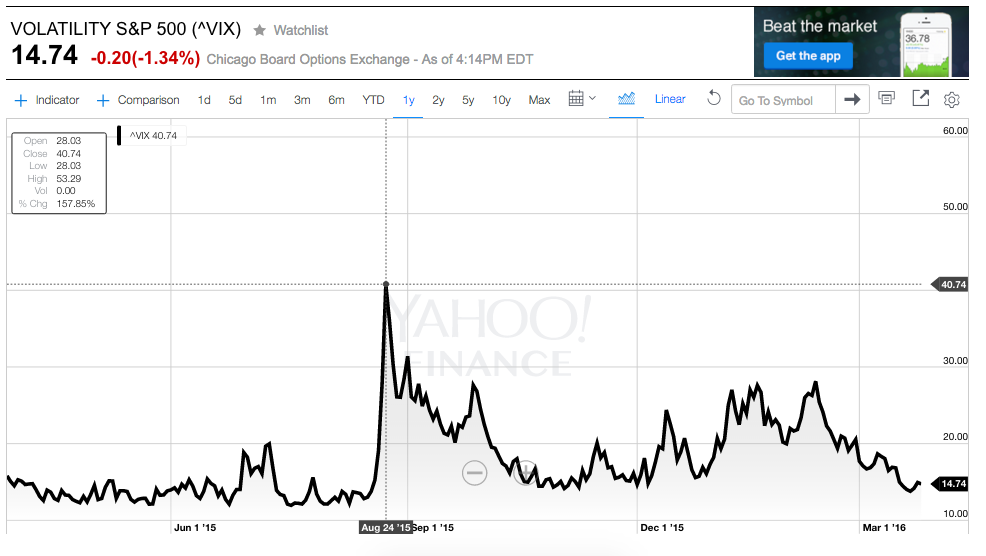
1) Short Covering: By mid January, and growing through the end of the month, an increasing number of people were pessimistic about market prospects. We can view the pessimism (or “fear” through this graph of the S&P 500 Volatility Futures, which reached 27 on January 20th, and then again on February 11th.
So obviously, quite a number of investors (retail and institutional) had some mix of short positions, inverse ETFs, and/or long put options. Therefore, once the market reversed and propelled upward, those positions were likely reversed or reduced – helping energize the upward move.
By the way, as big a surprise as the beginning of the year downdraft was[5], the amplitude of the S&P Volatility Futures graph last year between August 24th and the start of September was twice as steep and high (reaching over 54!).
Therefore, we can quite safely conclude that Short Covering played a role in driving the market upward following February 10th… but that alone is unlikely to have accounted for the up move.
2) Bullish Investors: Take a look at the following graph published by Bloomberg:
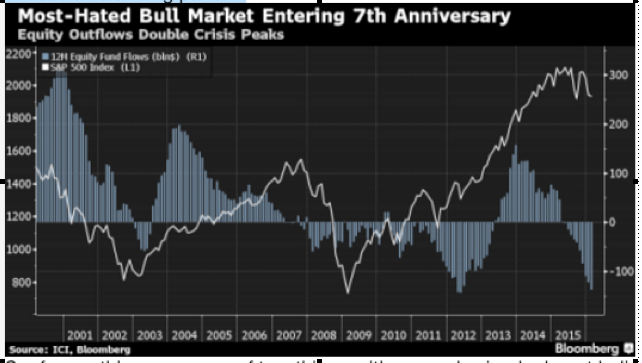
This graph contrasts with movement of the S&P 500 Index with the actual flow of funds into or out of equity funds.
Follow the direction of S&P 500 Index prices vis-à-vis the blue equity funds flow graph (reflecting positive flows above “0” and negative flows below “0”).
Logically, S&P prices would decrease as funds flow out of equities, correct? But we can see above that the S&P sometimes advances despite negative equity fund flows. Just look at how deep those negative flows were at the start of this year!
On March 15th, a number of sources quoted this eye-catching data from Bank of America/Merrill Lynch (author added unlinking for emphasis):
“Last week, during which the S&P 500 climbed 1.1%, BofA/ML clients were net sellers of US stocks for the seventh consecutive week. Net sales of $3.7 bn were the largest since September and led by institutional clients (where net sales by this group were the second-largest in our data history). Hedge funds and private clients were also net sellers, as was the case in each of the prior two weeks, but a different group has led the selling each week. Clients sold stocks across all three size-segments, and net sales of mid-caps were notably the largest since June ’09.”
Wow! Talk about a negative divergence! Retail and institutional clients (at BofA/ML) were net sellers… but the market moved up over 1%!
How did that happen?[6]
The answer to that brings us to our third point:
3) Post Earnings Season Activity: Can you identify two key developments that regularly occur prior to Earnings Season?
Answer: [7]
1) Implied Volatility on the options of companies scheduled to report earnings tends to rise, increasing the relative value to be found in selling option premium prior to earnings;
2) According to Goldman Sachs (GS) [and countless other expert sources] U.S. companies are required to refrain from discretionary stock buybacks during a so-called “Blackout Period” — lasting from approximately five weeks before their respective earnings reports to about 48 hours after earnings are reported.
Therefore it is significant to note that the February/March rise occurred after the bulk of Earnings Season was completed. According to Bloomberg:
“Buybacks ….. reached a monthly record in February and have surged so much they make up about 2 percent of daily volume.”
And we have this from Bank of America/Merrill Lynch:
“Buybacks of Industrials stocks by our corporate clients last week were the largest in our data history, and Materials buybacks were also near record levels. These two sectors, along with Staples, have led the pick-up in overall buybacks in recent weeks.”
Let me emphasize that corporate stock buyback activity is not inherently a bad thing. In fact, in many instances, it is the most efficient and profitable use of corporate-generated cash!!
However, guess what is needed in order to sustain current levels of corporate stock buybacks?
Corporate Earnings!
Unfortunately, the trend in earnings has been downward during the past several quarters. But a drop in earnings has not deterred buybacks in anyway. Consider this from Bloomberg:
“Buybacks, which reached a monthly record in February and have surged so much they make up about 2 percent of daily volume.”
And here is more from BoA/ML:
“Buybacks of Industrials stocks by our corporate clients last week were the largest in our data history, and Materials buybacks were also near record levels. These two sectors, along with Staples, have led the pick-up in overall buybacks in recent weeks.”
Then consider this from Bloomberg:
“…Corporations have unleashed the biggest debt-funded stock buyback spree in history, providing the natural offset to wholesale selling by virtually everyone else, and allowing the market to barely dip over the past year.”
If you enjoy slightly over the top quotes from market observers, here is one from Goldman Sachs’ David Kostin (chief U.S. equity strategist) offered during an interview on Bloomberg TV:
“Corporate buybacks are the sole demand for corporate equities in this market. It’s been a very challenging market this year in terms of some of the macro rotations, concerns about China and oil, which have encouraged fund managers to reduce their exposure.”
Lets quantify this market moving force:
1) A steady prominence can be identified within the market of corporate buybacks … starting in 2009 and growing during various quarters ever since then.
2) Since 2009, S&P 500 companies have expended approximately $2 trillion on share repurchases; during that period the market has (essentially) tripled.
3) As of earlier this March, S&P 500 companies were on pace to apply as much as $165 billion toward stock repurchases during this 1Q of 2016 – approaching a record set in 2007.
As hinted earlier, when we consider the volume of buybacks during the past few months, what makes this ongoing phenomenon of huge cash allocations for those buybacks simultaneously remarkable, puzzling, and worrisome… is the extent to which it is totally out of synch with the flow of funds from the “average investor”.
To whit:
1) Since January, retail investors (ie. you and I) have pulled billions from the equity market;
2) In fact, earlier in March, Bloomberg’s Lu Wang reported that if the pace of withdrawals continued at the same pace through the remainder of March, outflows would total $60 billion.
3) If one matches the withdrawals by retail investors with the stock purchases executed by companies… simple math reveals an incredible gap in bullishness (or lack thereof) of $225 billion. [ie. $165 billion + $60 billion].
4) Bloomberg reports that the gap between corporate and retail investor activity has not been that wide since 1998 [when a number of anomalies began to emerge (caused by the wildly unsustainable investment flows that eventually led to the infamous “Dot.com Crash”)].
It is of great importance, by the way, to note how this phenomenon (that has so mightily impacted the U.S. Equity market) manifested itself within news that emerged within Europe on (and after) the March 10th press conference at which European Central Bank Chief, (Super) Mario Drahgi announced ECB measures so sweeping that they literally blew away reporters, observers, and commentators. Review this summary from AGENCE FRANCE-PRESSE (the author used underlining below to highlight the main point at hand):
“The ECB lowered the main rate at which it lends to commercial banks – the so-called refi rate – to zero for the first time ever from 0.05 percent.
“Authorities also pushed the interest rate on its deposit facility for commercial banks to -0.40 percent from -0.30 percent. This means commercial banks in fact pay the ECB if they choose to transfer their excess funds at the end of the day.
“In addition, the bank increased the amount of its monthly debt purchases – which have so far been mostly eurozone government bonds – to 80 billion euros per month from 60 billion euros.
“The ECB said it would also start buying up corporate debt as part its monthly purchases.
“It will offer commercial banks another series of loans at ultra-low interest rates to ensure they have enough funds to lend to businesses.”
Did you catch these references in the quote above:
a) Adding purchase of corporate debt to its continuing purchase of Eurozone sovereign debt?
b) Ensuring enough funds to lend to businesses?
Why do you suppose those “tweaks” were added to existing ECB Quantitative Easing?
An answer is quickly suggested when you consider this chart of U.S. buyback activity relative to changes in corporate debt:
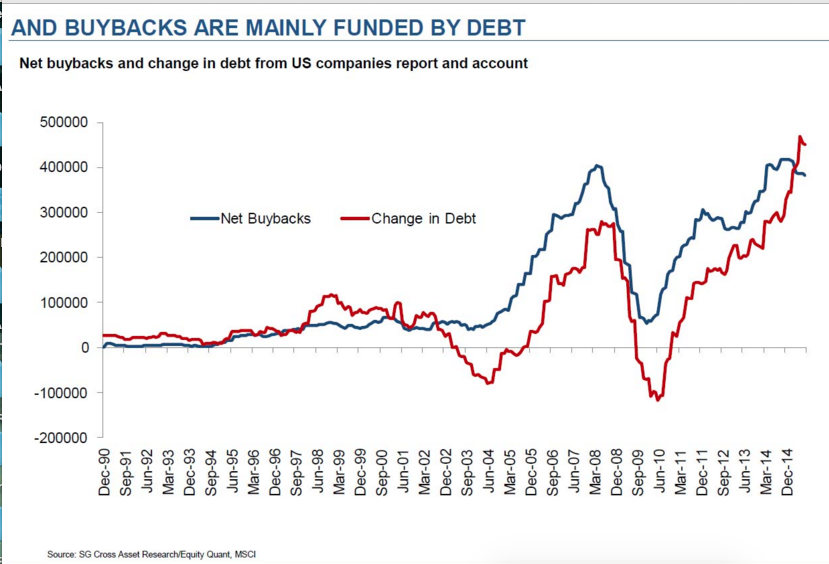
This graph reflects the parallel between the rise in corporate debt and the volume of share buybacks.
Look at the height of the red (corporate debt) line back in March of 2008. It was much higher than it had ever been since 1990. That dependence upon massive debt reflected the excessive “leverage” that nearly brought the world’s financial system down! We were (repeatedly) told that we had to “wring leverage out” of our financial system.
As we see, by June of 2010, much leverage had (indeed) been alleviated. But then follow the amazingly steep climb of debt from 2010 to today…. Marching in lockstep with, and then exceeding, the increase in corporate buybacks.
The reason for those parallel lines is simple – a great deal of the corporate buyback activity has been financed through the dirt-cheap debt available ever since the “father” of Quantitative Easing” (Ben Bernanke) started us (and later, the world) on the road to unprecedented monetary easing (and Zero Interest Rate Policy (ZIRP)). You may want to go back and review all the compelling reasons to use debt for buybacks that we enumerated here:
https://www.markettamer.com/blog/apples-newest-product-intro-the-i-bond-part-i and https://www.markettamer.com/blog/apples-newest-product-intro-the-i-bond-part-ii
The positive side of all of this buyback activity is that the stock market has helped hundreds of thousands of folks replenish their retirement accounts – formerly devastated by the disaster that was the “Financial Crisis”.
The negative side of this extremely high level of buybacks is at least three-fold:
1) If the most standard, foundational principle of investing is: “Buy Low/Sell High”… why are companies buying their stock when the market has been hovering at “new highs” for extended periods of time?
2) As Warren Buffett frequently observes, a company should only buy back its shares when it has absolutely no business/corporate use to which it can put that money which holds the potential of offering a higher return.
a) If the most productive use a company can find is the passive activity of buying its own stock… that in itself is either an implicitly negative commentary about the current economy; or
b) An unintended commentary on the lack of vision and entrepreneurial spirit among corporate leaders today.
i) Cynics would attribute the popularity of buybacks to the simple fact that when a CEO buys back company stock, it shrinks the number of outstanding shares… and thereby improves all of the company’s per share financial metrics.
ii) That, in turn, makes the CEO’s management skills appear more positive and
iii) At least in some instances makes it easier for a CEO and her management team to meet that year’s “goals” and earn their bonuses.
iv) And just think… I was always taught that a CEO’s obligation was to maximize shareholder return… not maximize his/her own bank account!
Finally, add one more very significant buyback “negative” to the above list:
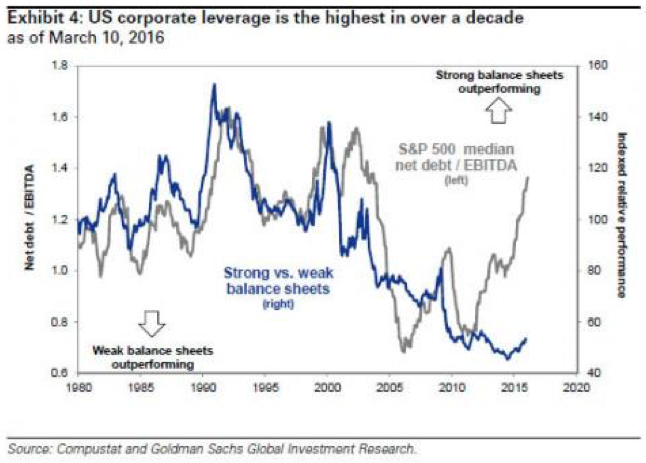
Because corporate loans have been so historically (and alluringly) “cheap” because of the Fed’s ZIRP policy, and therefore much of the buyback volume has been funded by debt, U.S. corporations (in the aggregate) now carry the highest leverage ratio that space has seen in well over a decade! Here is a graph that shows the S&P 500 median net debt/EBITDA ratio in gray (and shows that, at present, stocks of companies with weaker balance sheets are outperforming:
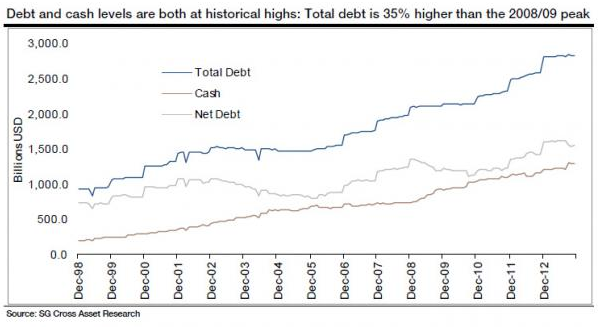
Just to amplify this point, Bank of America's credit strategist, Michael Contopoulos, has warned that U.S. corporate balance sheets are the “most unhealthy they have ever been.” And ironically, as the following graph shows, both Cash and Debt are at record levels. It is indeed sobering that total debt is 35% higher than at the peak in the 2008/09 period.
TAKEAWAY:
As we invest, it is important that (for the most part) we only pay cursory attention to much of the market content presented through the standard daily news shows on radio and TV. I almost always find the “sound bite” characterizations of why the market has moved up or down on any given day to be more amusing than enlightening. I simply remind myself that somewhere behind the scenes of said stories, there was a news story writer who frantically had to create some “explanation” for that day’s market action… and grabbed the easiest and briefest one (so the time slot for that report did not exceed the specified limit specified by a producer).
Even when it comes to the content on CNBC, Fox, and Bloomberg, I have learned that I have to maintain my skeptic’s ear because so many of the guest experts have an “agenda” related to what they say. Of course, the simple truth is that financial media channels exist for the very same reason that entertainment channels operate:
Not primarily to inform or to enlighten… but rather to capture “eyeballs” for commercials (to monetize their product) and to maximize ratings (so per minute commercial rates can be increased, for more monetization).
Therefore, when we assess the “condition” of the market at any given point in time, we need to keep in mind the following:
1) There are “micro forces” at play within the market each day… such as an economic report (the API[8] Oil Inventory Report, for example), a global news story (eg. the bombings in Brussels), a corporate earnings report, etc. These tend to be what is used to explain market action on any given day.
2) However, there are always bigger, more overarching, and often “invisible” forces at work within the market. I characterize such factors as “macro forces”. In the intermediate to longer term, those macro forces have much more impact upon market direction than do the countless (often opposing) micro forces.
That is why a daily focus upon the wisdom of Plato can be so beneficial to us as we trade and/or invest!
Always be leery of any given market analysis that purports to be “the only” correct understanding for that day’s (or week’s) market action. Always be skeptical of anyone who promises 100% accuracy on profitable stock recommendations. Always be skeptical of anyone who offers you a foolproof system for generating astounding profits in a relatively short period of time.
Instead, commit to a discipline of reading a wide variety of market and financial articles so you (over time) develop a mental framework through which you can more accurately and effectively interpret and integrate both micro and macro factors… and therefore be more likely to become one of the “few (who) perceives what has been carefully hidden.”
In the next article, we will explore the findings of a recent study that divides U.S. market history since 1950 into four “eras” and then identifies the primary macro force that most consistently moved the market during each one of those eras. You will especially want to learn what the study identified as the current key macro force.[9]
DISCLOSURE:
The author continues to be exposed to S&P 500 Index equities – through both a few individual stocks (eg. XOM) and through various mutual fund and ETF index products. Nothing in this article is intended as a recommendation to buy or sell anything. Always consult with your financial advisor regarding changes in your portfolio – either subtractions or additions.
FOOTNOTES:
[1] To put Plato in perspective, consider these quotes…
Alfred North Whitehead once noted: “the safest general characterization of the European philosophical tradition is that it consists of a series of footnotes to Plato.”
Plato is also frequently cited as one of the founders of Western religion and spirituality. To whit, Friedrich Nietzsche called Christianity “Platonism for the people.”
[2] Phaedrus, was a real person whose name means (roughly) “bright” or “radiant”. He was the first cousin of Plato’s stepbrother, Demos… and was born to a wealthy family sometime in the mid-5th century.
[3] “Ken” means perception, vision, understanding
[4] Most public companies report earnings quarterly… with the great majority of the big cap stocks reporting within a relatively short “window” of time. That is called “Earnings Season”.
[5] Widely labeled as the worst start on record for a new year in U.S. equity trading.
[6] Was Janet Yellen (perhaps) pumping Federal Reserve money into the market?
[7] Saying: “CEOs and CFO’s start taking daily doses of anti-anxiety drugs” is not an appropriate answer (however true it might be).
[8] API is the American Petroleum Institute
[9] Although I doubt that you will be surprised by the identity of this current macro force.
Related Posts
Also on Market Tamer…
Follow Us on Facebook



 Investing $60,000 in These 3 Funds Could Generate Annual Income of Over $6,500
