In the February 11th, 2013 Seasonal Forecaster newsletter I proposed a covered call trade in McDonalds that would return $1.04 in income, a 1.25% return over 34 days. That’s ‘only’ 13.2% annualized.
So many people stepping into the world of short-term trading (and even some serious long-term investors) think (dream?) in terms of making 20% per trade and a 100% return per year on their portfolios. A $1.04 return on a $95 stock doesn’t sound like much, does it? It can’t be worth it.
Seasoned traders know the real riches come from the ‘income’ trades, the trade and money-management strategies that produce consistent, regular income over long periods of time. MarketTamer’s Stock and Option Training for instance has whole modules and coaching sessions/webinars devoted to ‘Rock Solid Income Trades’ and similar topics.
Around mid-March of 2009, a good friend, Jim, asked me for suggestions on what to invest some spare funds into. He's conservative, so I suggested he consider buying a major company with a good dividend history, one that supplies a basic product or service used by everyone. I used McDonald's as an example. I went home and created a spreadsheet to show him how a good company like McDonald's could end up being one of his best investments.
Here's the email I sent him:
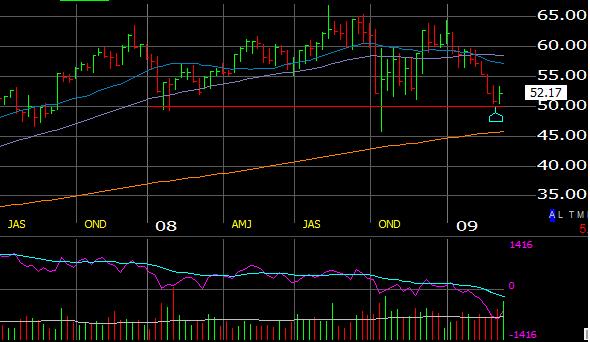
This is a weekly chart… Notice how MCD's been trading in a range (50 to 65) for a year and a half. It's twice fallen to the 50 level and bounced upwards. It's now back down to 50. Notice the high volume (the red/green bars at the bottom of the screen are the weekly volume levels – colored green if the stock closed up for the week, or red if it closed down for the week). The rightmost price, representing the most recent 5 days, shows it's again bouncing off the 50 level, on higher volume. This 50 level is now what's called ‘support'. The stock price will most likely stay above it. Good place to buy.
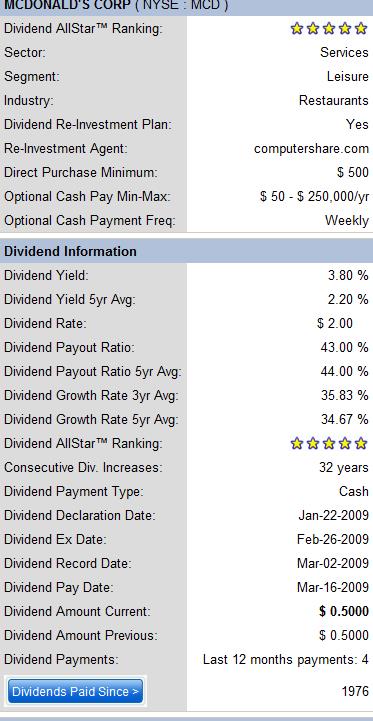
MCD currently has a Return on Equity (ROE) of 30, which is very good. This says the company is returning good value to the investor. Dividend Yield is 3.8%. Let’s look at the dividends:
(Note: I went to DividendInvestor.com for this information)
It's paid quarterly dividends since 1976, and has raised dividends every single year. It's 5-yr dividend growth rate is 35%. Let's plug this into a spreadsheet to see how dividend growth could play out:
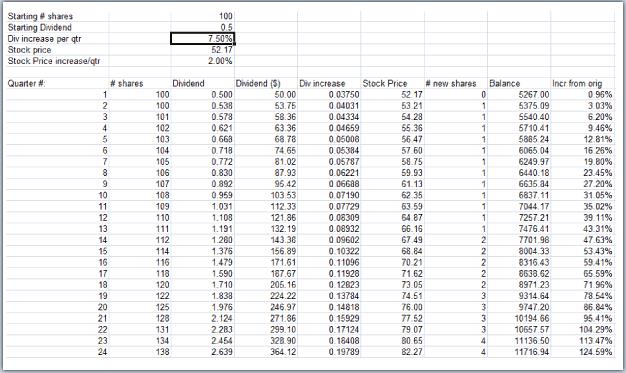
This worksheet calculates the effect of buying 100 shares of MCD, and having the dividends automatically reinvest. I plugged in a ‘Div increase per qtr' of 7.5%, because from above I see that MCD's 5-yr average dividend increase is 35% per year. A 7.5% increase per quarter comes out to about 35% per year. I also assumed in the worksheet the MCD's stock price would increase 2 percent per quarter. That's probably rather conservative, especially if the economy starts picking up a little.
But you can still see that this stock, with no further investment than the original 100 shares (and dividend reinvestment), could double within 22 quarters (little over 5 years). Most likely it'll be sooner. And at the 5-yr point, you’ll be getting around 4 new shares of MCD every quarter.
So how did MCD turn out?
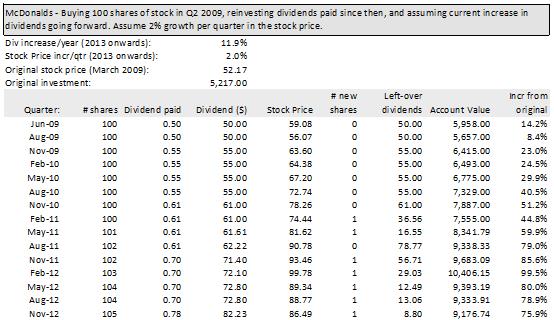
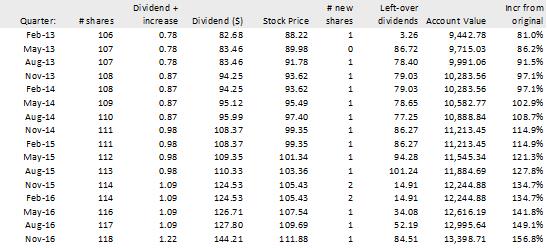
I created a spreadsheet with the actual dividends paid since my email to Jim, and the closing stock prices on the days the dividends were paid, to calculate reinvestment of dividends. The results from the 15 quarters since then come out to a 76% gain:
Jim cuts my hair, and just about every time I go to him, he says he should have listened to me. None of his IRAs or mutual funds have done that well.
I figured I’d just extend the spreadsheet to cover the next 4 years. DividendInvestor.com tells me that MCD’s current Dividend Growth Rate 3yr Avg is 11.88%, and the 5yr Avg is 14.02%. I’ll use the lower value, the 11.88% increase each year. I’ll also assume MCD will increase on average 2% a quarter for the next several quarters. That’s at the low end of its normal growth rate.
Plugging this into the second half of the spreadsheet shows that Jim, if he had followed this approach, in 4 more years could be up 150%, own 18% more MCD shares than he started with, and would be getting 1 to 2 new shares of MCD each quarter:
That is just from buying the stock and reinvesting dividends. Now I know Jim wouldn’t be interested in this, but a lot of Seasonal Forecaster readers are (I read all your emails). Let’s look at adding covered calls into the mix.
The Bid on the slightly OTM call expiring the next month, on the Monday right after an expiration, averages around .40 to .50. For example, say you had shorted January calls against your MCD stock, and they expired worthless on Friday, January 18th. You would be free to write new calls. The February 95’s, being slightly OTM, could have been sold for around .70-.75 on Tuesday morning, January 22nd (Monday was a holiday). That is a little on the high side. My experience is you can typically get at least .40 to .50 on new short calls, right after a previous expiration.
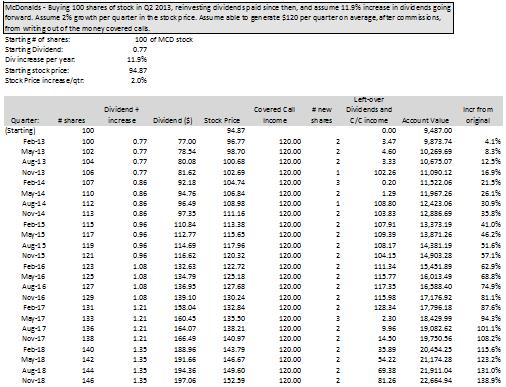
Starting with 100 shares of MCD at the current price, doing the dividend reinvestment scheme covered above, but this time adding in $120 per quarter from shorting calls against the stock, gives theoretical results of:
It may be prudent, on the months that MCD will go ex-dividend, to wait until after the dividend payment – same thing with earnings releases. So on the months there isn’t an earnings announcement or dividend payment, you may be able to sell calls at .75 to 1.50. You’ll likely get less on the months you wait. Considering that, I picked an arbitrary $120 per quarter in the spreadsheet above to approximate likely average income.
Considering that after 6 years, you could have almost 50% more shares of MCD stock than you started with, having not spent a dollar more, and you would have maybe $317 per quarter of income (dividends and covered call income), as well as any stock gains, does a covered call returning ‘only’ $1.04 sound that bad?
Of course, there's much more you need to know and many more stocks you can capitalize upon each and every day. To find out more, type in www.markettamer.com/seasonal-forecaster
By Gregg Harris, MarketTamer Chief Technical Strategist
Copyright (C) 2013 Stock & Options Training LLC
Unless indicated otherwise, at the time of this writing, the author has no positions in any of the above-mentioned securities.
Gregg Harris is the Chief Technical Strategist at MarketTamer.com with extensive experience in the financial sector.
Gregg started out as an Engineer and brings a rigorous thinking to his financial research. Gregg's passion for finance resulted in the creation of a real-time quote system and his work has been featured nationally in publications, such as the Investment Guide magazine.
As an avid researcher, Gregg concentrates on leveraging what institutional and big money players are doing to move the market and create seasonal trend patterns. Using custom research tools, Gregg identifies stocks that are optimal for stock and options traders to exploit these trends and find the tailwinds that can propel stocks to levels that are hidden to the average trader.
Related Posts
Also on Market Tamer…
Follow Us on Facebook

 2 Ultra-High-Yield Dividend Stocks You Can Buy and Hold for a Decade