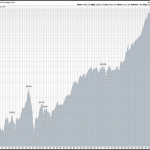
To get a feel for where on the aggressive/conservative scale I should position my trades, I've been looking at a lot of charts. I'm looking at volume patterns as well as price patterns.
Bull markets climb a wall of worry, they say. But my email is filling up with increasing amounts of proclamations from analysts and journalists of a major selloff. Some target 2016, some refer to ten days hence.
While my personal expectation is for a continuation of strength in the U.S. stock markets, I just want to make sure I spot any widespread institutional distribution as soon as possible.
One technique I use for filtering out the best trade candidates is to use the Up/Down Volume Ratio of stocks. Along with their proprietary Accumulation/Distribution rating, Investor's Business Daily frequently refers to a stock's Up/Down Volume Ratio as a gauge of institutional participation.
Up/Down Volume Ratio is the ratio of total volume on up-closing days, divided by the total volume on down-closing days, over 50 trading sessions. A value > 1.0 usually indicates more buying than selling interest, and a value < 1.0 indicates greater selling. In practice, I use a value greater than or equal to 1.3 to indicate strong accumulation, and a value less than or equal to 0.8 to indicate distribution.
From reading recent MarketWatch.com articles and many of the emails I've been receiving, one could easily come to the conclusion that there is little participation in recent market highs. So this weekend I took all of the stocks on the S&P 500 and ran the Up/Down Volume Ratio calculation on them.
What were the results? Looking for extremes, of the 500 stocks,
– 177 had an Up/Down Volume Ratio <= 0.8, indicating likely distribution
– 76 had an Up/Down Volume Ratio >= 1.3, indicating likely accumulation
So out of 500 stocks, 15% of them had volume patterns suggesting moderate to strong accumulation, and 35% of them had volume patterns suggesting distribution.
With 15% under accumulation, this suggests that a normal rotation is going on. Institutions are likely not dumping stocks to sit on the sidelines, but are merely rotating into their best candidates. While I am comforted for now, to keep an eye out for any change in market character I may run this calculation on a regular basis.
Of course, there's much more you need to know and many more stocks you can capitalize upon each and every day. To find out more, please click on the following link: www.markettamer.com/seasonal
By Gregg Harris, MarketTamer Chief Technical Strategist
Copyright (C) 2015 Stock & Options Training LLC
Unless indicated otherwise, at the time of this writing, the author has no positions in any of the above-mentioned securities.
Gregg Harris is the Chief Technical Strategist at MarketTamer.com.
The content on any of Market Tamer websites, products, or communication is for educational purposes only. Nothing in its products, services, or communications shall be construed as a solicitation and/or recommendation to buy or sell a security. Trading stocks, options, and other securities involve risk. The risk of loss in trading securities can be substantial. The risk involved with trading stocks, options and other securities are not suitable for all investors. Prior to buying or selling an option, an investor must evaluate his/her own personal financial situation and consider all relevant risk factors. See: Characteristics and Risks of Standardized Options (http://www.optionsclearing.com/publications/risks/riskstoc.pdf). The www.MarketTamer.com educational training program and software services are provided to improve financial understanding.
Related Posts
Also on Market Tamer…
Follow Us on Facebook

 Why IonQ Stock Is Soaring This Week


