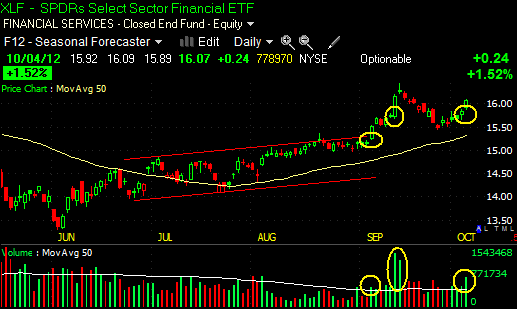
The XLF is looking strong. The past month has a couple of sharp moves upwards on above-average volume. As you know by now, I look to identify ‘tailwinds’ for my trades. I want to ride the coattails of the real movers of a stock or index, the institutions. I look for seasonal patterns that indicate regular annual participation of big players, like mutual funds and hedge funds. My money doesn’t move a stock, theirs does.
You might think XLF must have a strong seasonal pattern, as many sectors have good track records of price rises in the fall – the institutional traders seem to keep coming back year after year to buy up certain groups of stocks, and financials surely must be one such sector.
The XLF is an ETF described on Yahoo Finance as including “diversified financial services; insurance; commercial banks; capital markets; real estate investment trusts; consumer finance; thrifts & mortgage finance; and real estate management & development.” The top holdings include Wells Fargo, Berkshire Hathaway, JP Morgan, Citigroup, American Express, and Metlife.
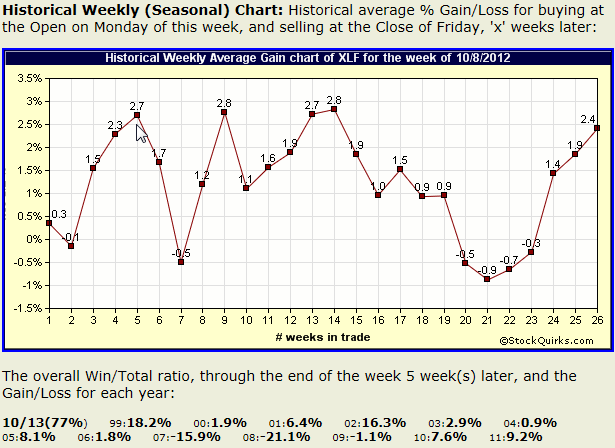
However, don’t go out buying a bunch of the top financial stocks, because XLF’s chart doesn’t represent them all. Even worse is my discovery of an erratic seasonal pattern. The next 5 weeks for instance has a seasonal pattern that shows anything but consistency or a directional bias:
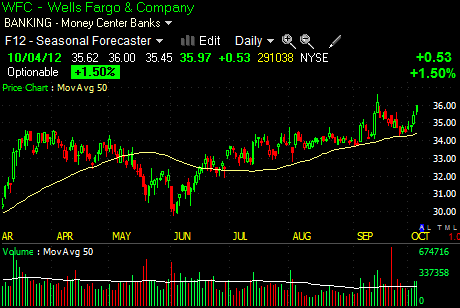
I looked into some of the top holdings of XLF. Wells Fargo, the biggest holding, hasn’t gone far, although in the past month it has shown some spirit. But it is only at 36 – it was at 33 three months ago.
Does WFC have any seasonal tendencies? Perhaps it is just getting started and has a strong seasonal tendency to rise due to institutional buying. Not really. Over the next 7 weeks, WFC has averaged a .4% loss, with gains in just half of the past 28 years:
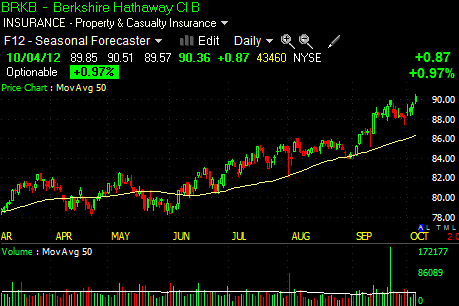
Berkshire Hathaway, the second largest holding in XLF, must be accounting for some of XLF’s rise:
Yes, BRK.B does look like it has been contributing. But Berkshire’s seasonal track record doesn’t show much evidence that institutions take interest in it this time of year.
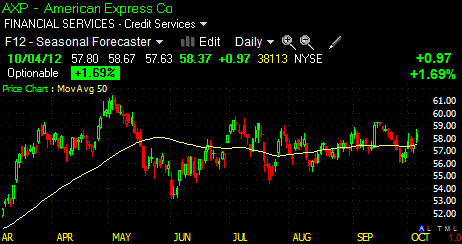
Well, another top holding, American Express, must do well this time of year. After all, it is a charge and credit card company, the back-to-school season has just passed, and the holiday season is just starting. AXP’s chart is disappointing though. Using a fat enough crayon, we could draw horizontal lines and make it look like it is in a trading range. That’s it – it is consolidating, building up strength for a grand finale!
Unfortunately, AXP’s track record doesn’t offer much encouragement. Weak average gains through the rest of the year with barely any directional bias:
Just because a sector or ETF’s chart looks good doesn’t mean all the top stocks in that sector are participating, or have a track record of participating in the near future. If you want to increase your odds, and your resulting success rates, you have to do your homework. Know your stocks, your sectors, your major indexes. There are good sectors, and many individual stocks, that have strong seasonal patterns right now and are forming good setups for possibly large moves. Look for tailwinds for your trades – it makes the sailing a lot smoother.
Of course, there's much more you need to know and many more stocks you can capitalize upon each and every day. To find out more, click here: www.markettamer.com/newsletters
By Gregg Harris, MarketTamer Chief Technical Strategist
Copyright (C) 2013 Stock & Options Training LLC
Unless indicated otherwise, at the time of this writing, the author has no positions in any of the above-mentioned securities.
Gregg Harris is the Chief Technical Strategist at MarketTamer.com with extensive experience in the financial sector.
Gregg started out as an Engineer and brings a rigorous thinking to his financial research. Gregg's passion for finance resulted in the creation of a real-time quote system and his work has been featured nationally in publications, such as the Investment Guide magazine.
As an avid researcher, Gregg concentrates on leveraging what institutional and big money players are doing to move the market and create seasonal trend patterns. Using custom research tools, Gregg identifies stocks that are optimal for stock and options traders to exploit these trends and find the tailwinds that can propel stocks to levels that are hidden to the average trader.
Related Posts
Also on Market Tamer…
Follow Us on Facebook




 3 Vanguard ETFs to Buy With $500