A lot of traders and investors are hesitant to trade higher priced stocks. Many are also hesitant about jumping on a stock that just broke out – they convince themselves to wait for a pullback to get in at a better price. The trouble with this is an especially strong stock may not even pause, let alone pull back and test the breakout level. In this article I’ll present a case why both approaches may not be in a trader’s best interest. While there are countless more recent examples, I’ll use one from a book the reader can check into for more of the decision process and similar examples.
18,000+ % over 7 years, 110% per year annualized, trading just stocks, results verified by KPMG.
I bet I have your attention. These are actual results logged by Gil Morales and Dr. Chris Kacher during the time they worked for William J. O’Neill + Co, Inc. In their 2010 book titled “Trade Like an O’Neil Disciple – How We Made 18,000% in the Stock Market”, they detailed the trades and the analysis process that produced those returns.
While they closely followed the trade selection philosophy of Investment Business Daily’s founder Bill O’Neill (How to Make Money in Stocks, 4th edition, William J. O’Neil, 2009), you will find many similarities between their approach and the accounts of many other successful traders.
One key fact not emphasized by many advisors and purveyors of trade recommendations is that most of the profit successful traders log each year usually comes from a small number of trades. Gil Morales made 1009% in 1999, and nearly all of it came from just two stocks – Oracle and Verisign. They simply identified a couple of stocks that had characteristics they thought would be attractive to institutional buyers, then bought and added more on each breakout as the stocks moved upwards. They rode the coattails of the big players. While a bit of luck was involved, their extensive analysis and experience put them in the position to identify and take advantage of the opportunities that were present.
To achieve this success, they traded a way many traders and investors have a difficult time accepting – they bought higher-priced stocks that continued to set higher highs.
Consider the psychology behind a stock heading towards triple digits and continuously setting new highs. Somebody, many somebodies, with very deep pockets, must be accumulating the stock on a steady, continuing basis. Whether it is one institution building a very large position or numerous smaller institutions and hedge funds jumping on a stock with a good story, the net result is a stock where buyers vastly overwhelm sellers for an extended period of time.
As short-term traders, if we can identity these stocks and implement our favorite leveraged trading strategies (using options for example), we will increase the chances of having our own 100+% returns per year.
Before getting into examples from Gil Morales’ trades, I want to emphasize that you don’t need to be able to expertly identify the O’Neil/IBD chart patterns or understand the CANSLIM approach. In many cases, applying common sense and estimating the likely ‘psychology of the crowd’ will achieve similar results. I’ll highlight this as I go along.
Let’s look at Oracle back in 1999. ORCL split 3-for-2 in March of 1999. I’m going to use non-adjusted charts to show the actual prices traders were faced with at the time.
After falling in the early part of the year, ORCL consolidated sideways for a few months. O’Neil calls this basing, but you can view it as a well-defined trading range:
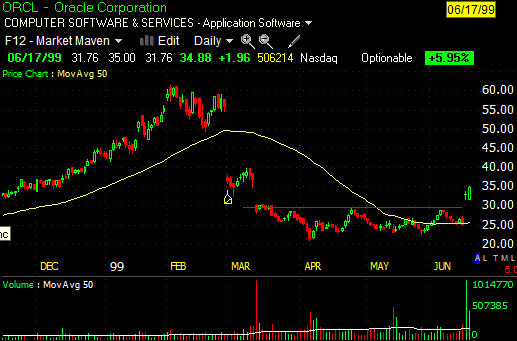
ORCL gapped out of the trading range in mid-June on high volume. Morales didn’t enter his ORCL position at this point because the general market was in a mild correction and there was a lot of uncertainty. But if you had thought about this breakout and entered and managed a new position, you could have had a great start. Volume had been low for the past month. All of a sudden ORCL gapped up and closed 31% higher on 250% higher volume. The following day ORCL had a solid up-day, again with strong volume.
At this point many traders would be hesitant to enter a new long position. Traders that either preferred lower-priced stocks or waiting for big breakouts to pull back and test the breakout level would have missed this opportunity.
Such sudden gains would surely be taken back, right? Sometimes they are, but when you see such sudden strength, the reasons behind it may support further gains. While it is always nice to buy on pullbacks, you are not always given the chance. A professional trader will take a partial position on a breakout like this. If the stock pulls back, but doesn’t hit a stop-loss, the trader can add to the position. If the stock just continues upwards, he or she will be in for the ride. An appropriate stop-loss will minimize losses if the breakout quickly breaks down.
For two months ORCL consolidated its gains. Gil Morales mentions he identified this period as being the handle in a cup-with-handle formation in ORCL’s chart. Morales realized ORCL’s high return-on-equity was likely attractive to institutions, but still held off on entering a position. However, if you had viewed it as just a trading range again, the breakout, again on above-average volume, would have offered another good chance to add to your existing position. After all, the stock was starting to prove there was more buying interest than selling interest.
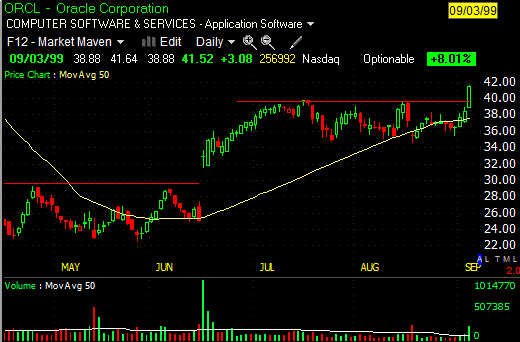
Once again ORCL traded sideways (another trading range!), staying above the 50-day moving average, and once again it suddenly broke upwards on above-average volume. This was another good time to add to the current position even though the price level of 50 may have made some traders uncomfortable. The high volume on the breakout was a key that there was still accumulation going on in the stock.
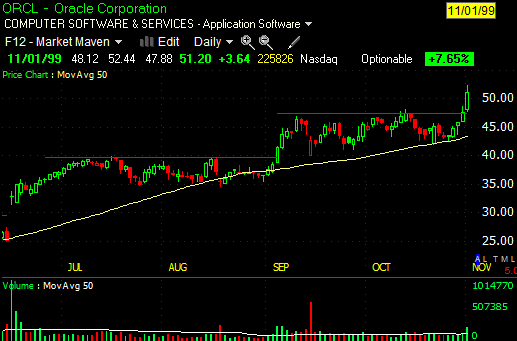
Morales called this a base-on-base, and finally began accumulating ORCL stock as it broke out of the second base. By mid-November ORCL had nearly doubled for Gil, but it was up 132% above the open of that first breakout in mid-June.
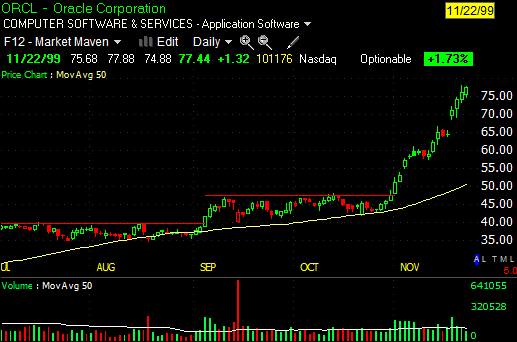
Notice how many of the days since that late October breakout had above-average volume. There was steady, continuing accumulation in the stock.
In mid-December, you guessed it – ORCL broke out of recent consolidation again. The low-price traders would be out of the game at this point, and if not, they certainly wouldn’t view this as another good time to add to the position.
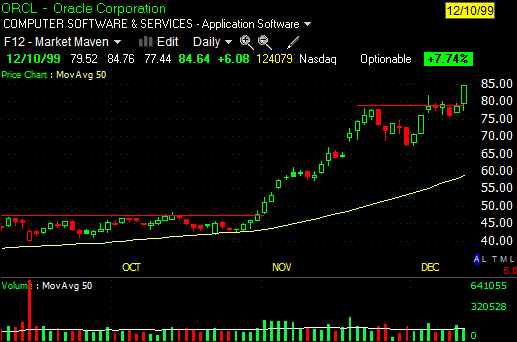
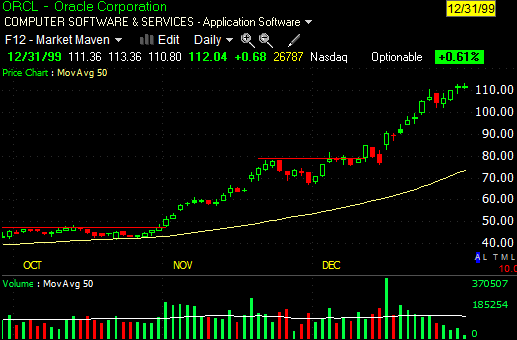
ORCL ran up to 113 before running out of steam. But this was just a temporary situation.
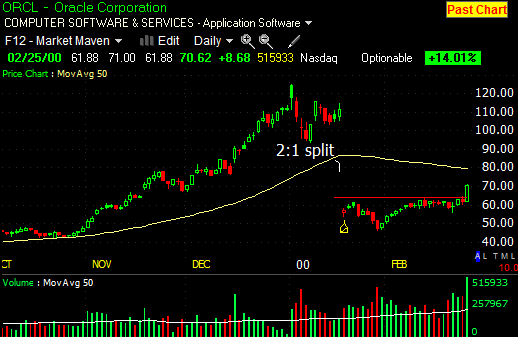
ORCL stock split 2 for 1 in January of 2000. Same story – ORCL consolidated sideways, bouncing nicely off the 50-day moving average (not visible in this non-adjusted chart). When it broke out, it did so on high volume. Another good time to add to the position.
ORCL consolidated in March 2000, then broke out again. But notice this time volume on the breakout, and subsequent days, was below average. The day after the breakout the stock traded in a tight range, closing near the bottom. This would have been a good time to consider moving a trailing stop up to just under the recent low of 76.
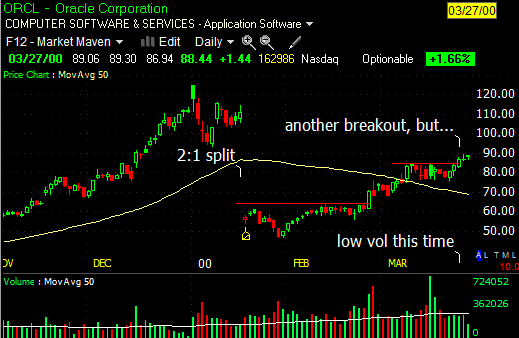
The high of 89.30 on March 27th represents a 445% gain from the original breakout in mid-June. The various additions to the original position would have produced a very nice profit. If leveraged trades have been implemented, such as stock on margin or long call options, the results would have been significantly higher. And each time it required entering or adding to a position on a stock that was moderately to highly priced and had been setting new highs.
Are you thinking this could only have happened in the great Internet bubble? There are stocks like this most of the time. Alternate between daily and weekly charts and you’ll find a number of current (9/2012) examples – AAPL and AMZN of course, but also stocks like Biogen Idec (BIIB) and even Colgate-Palmolive (CL). Not many will give the gains of ORCL in 1999, but coupled with various option strategies nearly every year has the potential for 100+% gains.
Do your homework. Not every stock that trades in a sideways range, and then breaks out on higher volume will turn into another ORCL. Look for other factors to support the possibility that institutions have an interest in the stock. Ride their coattails. But don’t be afraid of breakouts or high-priced stocks.
By Gregg Harris, MarketTamer Chief Technical Strategist
Copyright (C) 2013 Stock & Options Training LLC
Unless indicated otherwise, at the time of this writing, the author has no positions in any of the above-mentioned securities.
Gregg Harris is the Chief Technical Strategist at MarketTamer.com with extensive experience in the financial sector.
Gregg started out as an Engineer and brings a rigorous thinking to his financial research. Gregg's passion for finance resulted in the creation of a real-time quote system and his work has been featured nationally in publications, such as the Investment Guide magazine.
As an avid researcher, Gregg concentrates on leveraging what institutional and big money players are doing to move the market and create seasonal trend patterns. Using custom research tools, Gregg identifies stocks that are optimal for stock and options traders to exploit these trends and find the tailwinds that can propel stocks to levels that are hidden to the average trader.
Related Posts
Also on Market Tamer…
Follow Us on Facebook

 Panicking Over Trump's Tariffs? 2 Warren Buffett Pearls of Wisdom to Remember