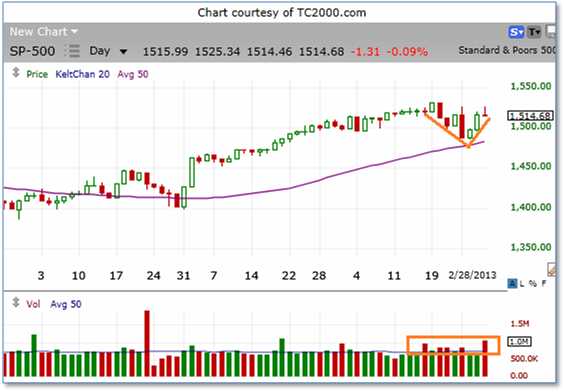
The S&P 500 is right back to where it started on Monday morning. It bounced nicely off its 50-day moving average. This could be a cyclical bottom, a classic reversal that makes a good entry point for bullish bets.
Not so fast. The two rebound days, Tuesday and Wednesday, were on below-average volume. Yesterday's candlestick is what's called a ‘Gravestone Doji', and where it formed, after two days up, can mean “that's it for now”. The fact it occurred on high volume, and the high formed a lower high than eight days ago, doesn't paint a good picture for the near term.
But let's give the market a day or two more, time to try on its new ‘sequester' suit, to walk around in front of the mirror and get a feel for how it looks.
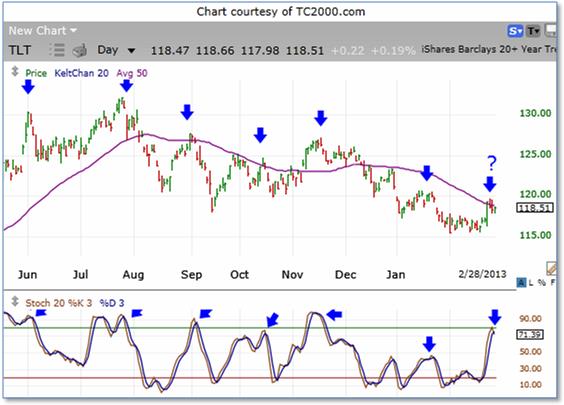
In the meantime, TLT, the ETF representing longer term bonds, has been regularly cycling up and down. It may have just formed another short-term high.
If I wanted to play a move down from a likely short-term high, shorting a $120 stock (ETF in this case) does not interest me.
Since previous drops off short-term cycle highs happen rather quickly, a near term in-the-money put may work as a lower-cost surrogate for shorting the stock. If I wanted the same exposure as shorting 100 shares of TLT, a March 124 Put could do it. There are 14 days left in March options. That should be enough time.
A March 124 Put's cost is currently about 5.85, and it has just $.10 of time value in it. It has a delta of 94. So if I was convinced TLT had set a short-term high, and wanted to play a pullback to at least 116 within the next two weeks, I could use a March 124 Put to make perhaps 20% or more on the move.
Let's look at the numbers:
1 March 124 Put bought at 5.85 = $585 at risk.
TLT drops from 118.50 to 116 within next two weeks = 2.5 points
Theoretical profit = 2.5 points * .94 delta * $100 = $235.00
Subtracting time value in case most of it evaporates = $235.00 – ($.10 * 100) = $225.00
Potential reward = $225 / $585 = 38.5%
TLT could fool me and continue moving upwards. A close above Monday's high of 119.35 would start to convince me I was wrong. The whole number 120 may act as a resistance level. So maybe 120.20 would make a good stop-loss. With a current delta of 94, that means a move from 118.50 to 120.20 would be 1.7 points, times the delta of .94 means a possible loss of $160 in that case. If all time value eroded, the loss would be $170.
The Reward-to-Risk ratio is $225 / $170, or 1.32. The normal ratio to aim for is 2 or 3 to 1. That's hard to achieve in option trades on an ETF like TLT.
Is there any other factors in favor of a downward move in TLT, to give such a bearish bet more ‘tailwinds'?
For a 2 week or less trade, it's hard to make any kind of case with seasonals or fundamentals. But if I was going to consider a longer-term bet against TLT, there are arguments for both.
Although there are only 10 years of history, over the next 5 weeks, TLT has lost an average 2.1%, with losses in 9 out of the 10 years:
Fundamentally, bonds may be near their peak. This is the best article I've seen describing how the reward-to-risk level on bonds makes them a poor bet for the upside:
If money keeps moving from bonds into stocks, regular downside bets on TLT may work well.
Of course, there's much more you need to know and many more stocks you can capitalize upon each and every day. To find out more, type in www.markettamer.com/seasonal-forecaster
By Gregg Harris, Market Tamer Chief Technical Strategist
Copyright (C) 2013 Stock & Options Training LLC
Unless indicated otherwise, at the time of this writing, the author has no positions in any of the above-mentioned securities.
Gregg Harris is the Chief Technical Strategist at MarketTamer.com with extensive experience in the financial sector.
Gregg started out as an Engineer and brings a rigorous thinking to his financial research. Gregg's passion for finance resulted in the creation of a real-time quote system and his work has been featured nationally in publications, such as the Investment Guide magazine.
As an avid researcher, Gregg concentrates on leveraging what institutional and big money players are doing to move the market and create seasonal trend patterns. Using custom research tools, Gregg identifies stocks that are optimal for stock and options traders to exploit these trends and find the tailwinds that can propel stocks to levels that are hidden to the average trader.
Related Posts
Also on Market Tamer…
Follow Us on Facebook


 If You'd Invested $1,000 in Shopify Stock 10 Years Ago, Here's How Much You'd Have Today