Within this space during past months, we have frequently alluded to the importance of: 1) sound asset allocation; and 2) disciplined risk management.
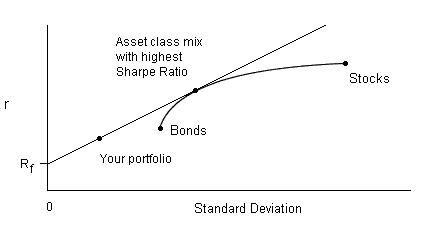
The importance of the first can be illustrated by reference to the “Efficient Frontier”[1]. Consider this “Risk/Reward” graph, with the horizontal axis representing “Investment Risk”[2] and the vertical line showing “Investment Return”. Just as one would assume, (historically) stocks offer a higher return (higher on the vertical axis) than bonds, but also involve a commensurate amount of higher risk (further right along the horizontal axis).
 Knowing that I would be so excited about capturing maximum investment return over my investment “horizon” that I would gladly do cartwheels[3], there might be moments when I’d consider going “all in” on the SPDR S&P 500 ETF Trust (SPY). Just think of it, my portfolio would be up almost 20% year-to-date (YTD), and I’d be up about 23% YTD compared with a portfolio invested entirely in bonds (example: iShares Core Total US Bond Market ETF (AGG))!!
 Alas, each of you is well aware of the essential (and timeless) problem intrinsic within an all-stock portfolio – excessive risk! If I had invested in “all stocks” (SPY) from January 1, 2008 through September 27, 2008, my portfolio would be down about 19%, and would have performed some 16.5% worse than an all-bond portfolio (AGG)! I’m not sure that either Ambien or Lunesta could assure me of restful nights under such circumstances!
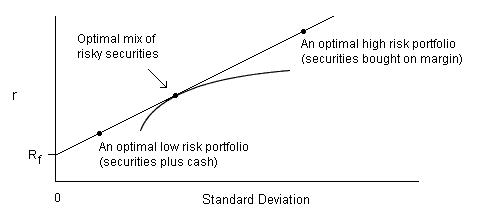
Helping investors sleep better is the simplest explanation for why sound asset allocation is important! We need to do our best to find an “optimized mix” of investment asset classes for our portfolio – one that is potentially able to provide us with a decent annual return for the level of investment risk we are willing to accept! That is where Markowitz and Sharpe come into play. Their mathematically driven “Efficient Frontier” illustrates for us our alternatives along the “Return/Risk” spectrum. This graph illustrates the way the mathematics works, given an overly simple blend of stocks and bonds. The spot along the curve that is marked “Optimal mix of risky securities” illustrates a point of investment “efficiency” within that asset mix.
Of course, we all know that some folks prefer “lower risk” and some prefer “higher risk”. The latter folks may choose to buy securities on margin (moving up and to the right on the curve) while those who prefer a bit less risk could include more cash in our portfolio (moving down and to the left on the “frontier”).
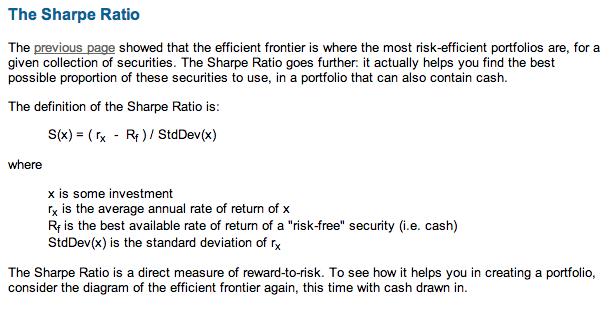
There is one other key piece you need to see with regard to this concept – the Sharpe Ratio. It is the calculation used to identify the optimum[4] mix of any given set of potential (acceptable) asset classes within a portfolio.
We have just provided you with a quick reminder/review of the crucial role of asset allocation within your investment planning. Inherent within that process is some measure of “risk management”.
However, as the Market Tamer coaches, video lessons, and market analyses remind us weekly, every trade we initiate requires disciplined risk management as well – proper position-sizing, money management, use of stops, careful attention to implied volatility, and knowing in advance how you intend to handle option expiration dates, etc.
That is an awful lot to keep “front of mind”, isn’t it? No wonder there is so much material each day within the website – blog articles, countless on-demand video lessons, archived coaching lessons, etc.! The world of investing is an infinitely fascinating one, but it can also be extensive!
Consider a simple discipline that I’ll bet every last one of you has heard about at one point or another – but I will (with equal conviction) bet that few of you regularly practice it: portfolio rebalancing!
Portfolio Rebalancing is as simple as following a preset plan to restore the precise percentages of your asset allocation strategy on some regularized, systemic basis! The only “complexity” comes with regard to which criteria you choose to utilize as “triggers” for such rebalancing. The simplest examples include:
1) Chronological: once a year; once a quarter; once a month.
2) Levels of allocation “skew” that trigger a reallocation – example, a “10%” trigger could be chosen, meaning that whenever your largest asset allocation moves 10% above or 10% below your optimum allocation strategy, you rebalance!
Let me illustrate. Let’s assume I have a $100,000 portfolio. Let’s assume (for simplicity) that my “optimum” allocation is 60% SPY and 40% AGG. If I started on January 1st, then (as you saw earlier) my approximate portfolio composition would currently be (9/27/13):
SPY $71,700
AGG 38,400
$110,100
Therefore, to restore my preferred asset allocation model, I would need to sell $5,640 of my SPY and invest that amount into AGG!! This would result in an allocation of:
SPY $66,060
AGG 40,040
$110,100
Sounds pretty elementary, doesn’t it, Watson?!![5]
However, there is the little matter of the human psyche – a force often to be reckoned with!
 A simple illustration: I know that the Federal Reserve will “taper” asset purchases at some point in the future (if they don’t, they will eventually own all U.S. Treasury Securities!). The bond market has already demonstrated its fear of that process by staging the worst bond performance[6] since 1995! Why on earth would I want to reduce my holdings in a “hot” asset (stocks) and increase my holdings in the (now) widely hated bond market? Do Markowitz and Sharpe think I am an idiot?
Do you see the flaws in the thought process above?[7]
The biggest flaw is the phrase “I know”!! Don’t get me started on the complexities of “knowledge” – if you do you’ll be mightily sorry! Suffice it to say that epistemology[8] is complicated – yes, even more complicated than investments! Take a quick look at the diagram to the right. One of the weaknesses of human beings[9] is a tendency to confuse “knowledge” with “belief”… or much more commonly, “assumptions”!!
The fact is, my friends, that within the world of investing, I hardly ever “know” anything about the future! I do have certain prejudices, some beliefs, and a lot of preferences (those things for which I hope); but I have practically nothing that I truly “know”.
In that regard, let me draw your attention to two apropos quotes:
“You must stick to your conviction, but be ready to abandon your assumptions.” — Denis Waitley [10]
“Most of our assumptions have outlived their uselessness.” — Marshall McLuhan [11]
I can’t emphasize enough to each investor how crucial it is for all of us to remain aware of the huge difference between what we “know” and what we can only claim to “assume”. Failure with regard to that discipline can get us into significant trouble – and cost us a “bundle”.[12]
We are now ready to move from theory and concept to some specific examples of the power of rebalancing! Countless studies of intermediate to long-term rebalancing have been completed through the years. In this article, I’ll share just a couple typical studies.
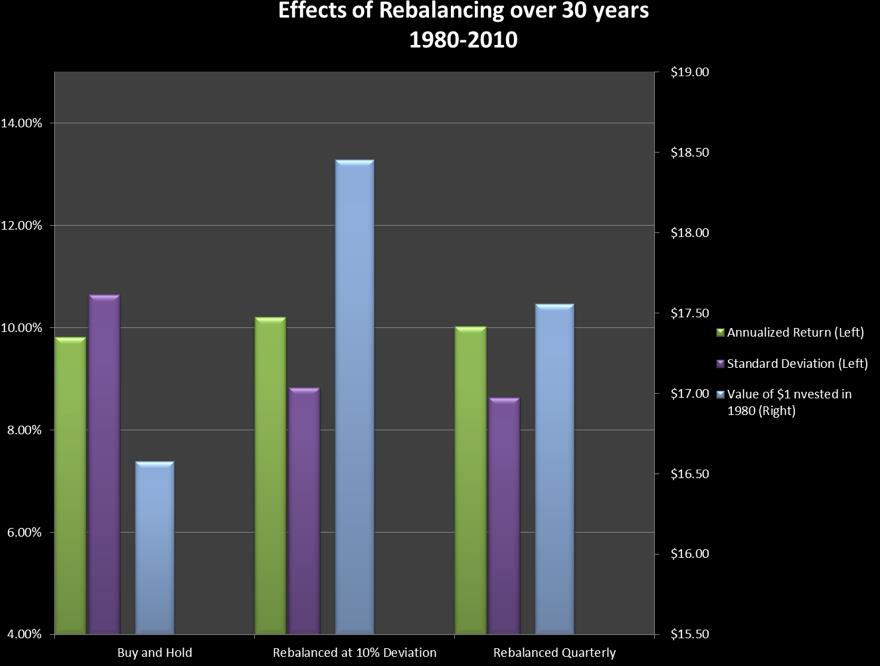
Friedenthal Financial issued a thirty-year study of the period between 1980 and 2010. That particular period offers a rich data set because it includes a great bull market (starting in 1982), the single worst day (point-wise) in Dow history (during October of 1987), and both the “Dot.com” bust and the “Mortgage Crisis” from our most recent full decade.
The investment allocation chosen was 50% S&P 500 and 50% Citigroup Broad Investment Grade Bond Index and the exact portfolio hold period was between 6/30/1980 and 6/30/2010! The assumption is made throughout all strategies that dividends were re-invested.
There are three strategies represented: 1) “Buy and Hold”; 2) “Rebalanced at 10% Deviation”[13]; and 3) “Rebalanced Quarterly”. And speaking of “assumptions”, there was an assumption made regarding transaction costs — $15 per transaction.[14] Allow me a very brief word about that fee assumption. For the first 10-15 years of that period, such an assumption would have been (for average investor) quite low; today, that same assumption could very well be on the high side. I remember trading options back in the 1980’s – it was expensive! In that sense, we are richly blessed in 2013 – we have much more efficient, affordable transaction costs. The (relatively) high transaction costs of the 1980’s (and earlier) actually made rebalancing significantly more costly – particularly if it was done more often than annually or quarterly. That was a significant reason more folks stuck with a “buy and hold” strategy in those days!
Take a look at the chart, folks! What stands out?
If I were to guess what caught your eye, it would include at least the following:
1) Higher Return when Rebalancing: a 0.4% higher for the Strategy on Line 2! That is about 11.3% greater appreciation over the 30-year period! Not bad!
2) Lower Risk when Rebalancing: calculating reduction in “risk” can be tricky, but my simple math indicates that the Line 2 Strategy experienced about 17% less risk than buy and hold!
3) Rebalancing at 10% Deviation outperformed the performance within both the Line 1 Strategy and the Line 3 Strategy!
The points in 1) and 2) above are self-explanatory. Point 3 suggests the need for some personal reflection. Each investor must decide on her or his own if the incremental return from the Line 2 Strategy is worth the (likely considerable) extra work involved in monitoring the entire portfolio to ascertain when there is a 10% deviation in allocation.
What powers this outperformance through rebalancing, while simultaneously lowering risk? It is simple. The great majority of the performance metrics are explained via the “Efficient Frontier” theory itself. However, a couple of specific factors can be identified:
1) Matching uncorrelated or negatively correlated assets within a portfolio can be very helpful (example, bonds and stocks; commodities and real estate can add a plethora of other less correlated assets);
2) Among those uncorrelated assets, some will have a bad year while others enjoy a great year, and the synergy within the portfolio can ease its volatility;
3) If there is something we can “know” in the investment world, it is “reversion to the mean”. Nothing goes up forever! Yes, some assets can and will go to zero; but no asset will continually zoom higher over a prolonged period of time. In fact, the steeper the upward trajectory on such a move, the more likely it is that it will experience a precipitous fall!
4) As we rebalance, we are utilizing the most elementary investment rule of all – “buy low and sell high”. And we are doing that by letting the market itself determine “high” and “low” instead of us trying to “divine” that on our own!
One other important thing that rebalancing does for us is to keep us in charge of what “powers” or “drives” our portfolio! If we don’t rebalance, then (over time) the market will determine the (relative) degree to which any one asset in our portfolio is driving our investment return. On the other hand, when we choose to systemically rebalance, we maintain control over our strategy and ensure that we optimize that strategy![15]
Here is a graph of the study we have just reviewed:[16]

A second, more recent study, covers the most recent 10-year period. The data details are courtesy of Eric D. Nelson, C.F.A. In this study (January 2003 through August 2013), Mr. Nelson compared the performance of two different strategies: 1) Rebalancing the firm’s “Base Portfolio”: a “65/35 Asset Class Mix”[17] once each year on 12/31; 2) Never balancing the firm’s “Base Portfolio” (as described below). Here is the data table (ignore line 3 for the moment!):
As you review this data set, you can see a slightly different “angle” on the benefits of rebalancing! Over the ten-year period, the incremental return from rebalancing is “only” 0.2% (I’ll happily take that additional return!). However, the overriding benefit from rebalancing can be seen in the much higher losses incurred during 2008 and 2011 by the investor depicted on Line 2. Yes, I would lose sleep over a 25% loss in 2008 within my rebalanced portfolio; but I would suffer sleep deprivation from the months I’d have suffered in the non-rebalanced account!
Now consider the following bit of (very imprecise, but quite suggestive) insight. Anyone who went through that ten-year period without rebalancing subjected her/himself to investment risk that was similar to (not identical to) the risk inherent within a 90% stock/10% bonds portfolio!!
The main point here is that if an investor is going to suffer the volatility experienced within the non-rebalanced portfolio, that investor might as well have had a 90% stock/10% bonds allocation and benefited from the incremental 1.8% return earned by that stock-heavy portfolio!
Now, consider this permutation on the above study. Let’s consider the “power of the human psyche” that I referred to at the beginning. Let’s remember what the markets were like in the midst of the 2008 crisis. Would you have had the intestinal fortitude to rebalance from bonds into stocks as the Dow Jones Index was heading toward 6,627?? What happened if an investor rebalanced that 65/35% asset mix portfolio at the end of each year except for 2008 and 2011?
What we see in this data set is that the investor who “chickened out” of rebalancing in 2008 and 2011 suffered a 0.5% decrease in overall return for that 10-year period! Fascinatingly, the return received by said investor over those ten years was similar to that of an investor who, during the same ten years, invested in a totally balanced 50% stock/50% fixed income portfolio[18].
What this means is that the investor depicted on line 2 might as well have been invested 50% stocks/50% bonds during the entire ten year period, gotten much better sleep at night (due to much lower volatility), and received a total improvement in returns during 2008 and 2011 of 15.6%! That should be eye opening for everyone!
INVESTOR TAKEAWAY: As we all know, investment and stock market “educators” spend a great deal of time teaching us how to decide what to buy, when to buy it, how to determine exit points, etc. In addition, based on my reading of today’s trader education material, there seems to be some consensus that the average investor is more effective at buying than at determining the most appropriate times to sell[19]. Here we have just outlined a handful of easily grasped concepts that any investor can incorporate into his or her investment strategy (and execution). We have also established[20] that the quite manageable tool of “rebalancing” is a potent force within portfolio management – a force that can make a substantial difference in investment return, especially as it is compounded over time. In addition, as it works in your portfolio to be accretive toward performance, it serves to reduce portfolio volatility, thereby adding a very delightful “frosting” to the “cake” of performance. It is the optimization of that Reward/Risk Curve (spectrum) that earned Markowitz and Sharpe a Noble Prize!
DISCLOSURE: Please note that under some circumstances, rebalancing will not be accretive toward positive investment performance. As an elementary example, between 1975-2004, REIT’s had an IRR of 15.2%. That return was (by far) the best among all major asset classes (the number two asset during that period was Emerging Markets, which returned 10.7%). Therefore, rebalancing within a portfolio that included a significant weighting in REITs would have been “dilutive” of return. However, we never know in “prospect” what the return of any given asset class will be. Therefore, since the power of rebalancing has been proven over time to be a very powerful tool, isolated instances within which it is dilutive should not be given undue attention.
Nothing in this article is intended as a recommendation to buy or sell anything. Always consult with your financial advisor regarding changes in your portfolio – either subtractions or additions.
Submitted by Thomas Petty MBA CFP
[1] Important economic/investment research compiled by Noble Prize winning theorists: Harry Markowitz and William Sharpe.
[2] Most frequently measured by “Standard Deviation”.
[3] Trust me — that would be such an ugly event that I would never subject anyone else to the pain of watching it!
[4] “Optimum” refers to the mix of assets within a portfolio that will provide the greatest investment return “reward” per unit of “risk”.
[5] For the one or two that don’t “get” the reference, it is to Sherlock Holmes and his friend/colleague, Dr. Watson.
[6] Between May and the September Federal Reserve Board meeting
[7] I sure hope you do. There are several flaws!
[8] This is the classic term for the “study of knowledge”. It is much older than I am – extending back to the centuries of (and before) Aristotle and Plato.
[9] A weakness that often reaches epoch proportions among investment commentators and politicians…
[10] Most of you won’t know who Waitley was. Suffice it to say that he was an American writer, motivational speaker, and the author of 16 books. He also was rather famously caught (late in his career) having claimed two academic degrees (post graduate) for which no one could find documentation. However, that should not detract from the essential truth of his quote.
[11] Those about my age will likely remember Mr. McLuhan. He is most closely associated with advertising and TV because of his seminal work within the field of communication theory. He coined the phrase “the medium is the message”, as well as the “global village”. Alas, by the 1970’s, his work became somewhat passé. However, because he publically predicted the World Wide Web about thirty years before it was invented, his work has re-blossomed as the Internet has come of age! (Take that, Elon Musk – McLuhan saw further ahead than you did!)
[12] An excellent case in point are all the “experts” who “knew” the Federal Reserve was going to announce the beginning of its asset purchase “Taper” on September 18th!
[13] This means the same thing as my earlier example, that I termed “skew”.
[14] To account for broker fees and Bid/Ask spreads.
[15] In the rubric of today’s portfolio managers, when we rebalance, we maintain some control over which assets are the primary assets to which we “attribute” our portfolio gains – gains which are “accretive” to the portfolio. (I am still uncertain whether I am more amused or bemused by the way investment manager terminology has evolved. Back in “the day” – we simply said: “These stocks contributed toward our 21% gain and these bonds and stocks detracted from our return!” Now we have “attribution” that is “accretive” or “not accretive” in this “space” or that stock. I think it is all just part of an effort for those who are “up and coming” to impress their employers and clients.
[16] From http://friedenthalfinancial.wordpress.com/2010/07/20/asked-answered-buy-hold-vs-rebalancing/
[17] Globally diversified. Includes: 13% DFA Large Company Fund (DFUSX); 13% DFA Large Value Fund (DFLVX); 19.5% DFA US Small Value Fund (DFSVX); 6.5% DFA Int’l Value Fd (DFIVX); 6.5% DFA Int’l Small Value Fd (DISVX); 6.5% DFA Emerging Markets Value Fd (DFEVX); 35% DFA Five Year Global Bond Fd (DFGBX).
[18] Globally diversified. Includes: 10% DFA Large Company Fund (DFUSX); 10% DFA Large Value Fund (DFLVX); 15% DFA US Small Value Fund (DFSVX); 5% DFA Int’l Value Fund (DFIVX); 5% DFA Int’l Small Value Fd (DISVX); 5% DFA Emerging Markets Value Fd (DFEVX); 50% DFA Five Year Global Bond Fund (DFGBX)
[19] A lot of that can be related back to the human psyche.
[20] Hopefully, beyond any doubt you might have had.
Related Posts
Also on Market Tamer…
Follow Us on Facebook


 You Don't Need Talent to Succeed: Lessons From Warren Buffett's Lifetime of Investing


