Let your imagination take over for a few minutes. Imagine that in 1970, a golfer made a friendly wager with the Professional Golfers Association that, for an indefinite period into the future, the five-year rolling average of his tournament play golf scores[1] would beat “Par”… and he would spot the PGA a couple of strokes, just to be sporting!![2]
 So how did that “friendly wager” play out over the past (almost) four and a half decades? Amazingly well! That golfer has succeeded in besting “Par” on a five-year rolling basis during all these intervening years… years that witnessed the retirement of such golf legends as Ben Hogan, Sam Snead, Arnold Palmer, Jack Nicklaus, and Gary Player![3]
You may be thinking: “Big Deal! Beating par is not that hard!”
I agree that on any given day, beating par is extremely manageable. However, beating par on a consistent basis – month after month, year after year, can definitely be a challenge!! Just ask your favorite golfer friend… or Tiger Woods when he is struggling with a knee injury or the inevitable major “slump” in his putting or approach game! After all, there is a good reason that “Par” is such a long-lived standard for golf excellence!
And remember, our golfer friend promised to beat Par by a couple of strokes! Therefore, he made his bet even more challenging than the “standard”!! That takes a lot of confidence, or a major case of being foolhardy. But you must give that man his “props” – he has had an amazing run of consistent success!
However, the anniversary of his bet is fast approaching (February) and it appears that his amazing string is about to be broken! The “golfing” world is abuzz with the impending fall of this record – because there is nothing quite as eye-catching as an icon taking a big fall!!
Now you are thinking to yourself: “Golf icon? Record about to fall?? Which icon is that? I have not heard one word about any golf record about to fall!!”
My friend, you are absolutely correct! The above story (as some of you have undoubtedly already guessed) is an analogy. The “golfer” in the story is actually Warren Buffett… whose professional field of play is not the golf course, but rather the corporate boardroom and the stock market. He took over the ownership and control of an aging textile manufacturer (Berkshire Hathaway (BRK-A)) in the mid 1960’s… and transformed it into a diversified corporation with a market cap of almost $300 billion!
To what does the “Par” in my story refer? It refers to the most commonly referenced U.S. equity index: the S&P 500 Index. And what do I mean when I indicate that he would “beat” Par? Well, I confess that Buffett never actually promised to give himself a “handicap” by requiring that he “beat” the index by a couple of percent each reporting period. However, based on the fact that the standard to which Buffett has held BRK-A is a side-by-side comparison of the growth in the BRK-A net Book Value/Share[4] vis-à-vis the growth of the S&P 500 Index price, plus dividends… Buffett is automatically putting himself at a significant disadvantage!!
“How is that?” you wonder. BRK-A does not distribute dividends. Instead, it takes all the cash flow it receives from its operating businesses (and investment income) and either reinvests that cash in its daily business operations, or makes new investments. Therefore, a BRK-A shareowner will owe income tax on any shares she/he sells during any given tax year … but only gains for that sale! In contrast, anyone who owns the equivalent of the S&P 500 Index (directly or through an ETF or fund) will have income tax liability each year for any shares sold, plus any/all dividend or capital gain distributions received during the year.
The bottom line is that Buffett therefore operates at a disadvantage in his continuing efforts to keep up with or exceed the growth of the S&P 500 Index (plus dividends). If there was a way to “adjust for tax consequences”, Buffett’s past success would have been even more startling! And he would likely not be facing the possibility that his record will fall this year!
Let’s look at the comparison data for the most recent reporting period (the 3rd Q ended September 30th, 2013), to which BRK-A and the S&P 500 Index will add the 4th Q 2013 in order to calculate the most recent Five-Year Average relative performance metric:
1) Since the end of 2008, the S&P 500 Index (including dividends) has returned 128%.
2) During the same period, BRK-A Book Value/Share has risen 80% (to $126,766/share).
3) Therefore, the performance gap that BRK-A would need to make up during the final three months of 2013 was so large that it is a virtual lock to have fallen short for this five-year period!
So Buffett’s amazing run is about to come to an end! (We’ll know for certain when the BRK-A’s EOY Financial report is released (the 2012 financial report was dated March 1, 2013). However, no matter what report you read or commentator you hear when those totals become “official” – keep the following thought in mind.
Corporate titans and political leaders are notorious for “moving the goalposts” when the time comes to evaluate their performance. This blatant lack of consistency and integrity is a major contributor to public distrust!
In sharp contrast, Warren Buffett has been consistent, constant, and even “confessional”[5]. He stipulated that the appropriate performance metric through which to evaluate Berkshire stock is: Book Value/Share versus the S&P 500 Index (with dividends). And Buffett has been steadfast in maintaining that metric!!
More dramatically, Buffett begins each Annual Report with a spreadsheet comparing those metrics year by year – for all of the world to see!
One of the partners at Gardner, Russo & Gardner, Tom Russo, echoes all fair-minded experts when he commends Buffett for his impeccable integrity: “He’s been awfully honest” [by keeping the goal the same] He didn’t pick it because it was an easy benchmark!”
Say what you will about Warren Buffett’s age, folksiness, conservative investment style, or (lack of) “hipness” – no one can deny that he represents a whole lot of what has made our country great, including:
1) Work ethic;
2) Discipline;
3) Dependability;
4) Entrepreneurial spirit;
5) Humility;
6) Integrity
7) Generosity (he gave $2.6 billion to charity in 2013 alone!).
Let’s take a few moments to review the long sweep of Buffett’s investment record.
The Book Value/Share of Berkshire Hathaway stock was all of $19/share in the mid 1960’s, when he took over. Since then, Book Value climbed to $114,214/share (at 12/31/12). That works out to be a compounded annual growth rate of 19.7%!![6] Sign me up, please!
Meanwhile, the S&P 500 Index grew at a mere 9.4% annual pace during those same decades!
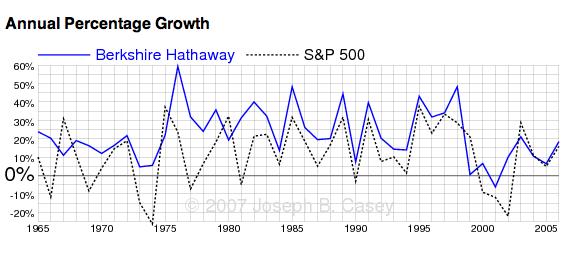
Here is a graph of BRK-A annual growth between 1965 and 2006. Note the obvious fact that outsized relative performance by BRK-A was much more obvious in mid to late 1970’s and mid 1980’s than it has been recently!
 The following report suggests a major reason why “investment growth” slowed as the BRK-A portfolio grew exponentially! Wall Street money managers all know that it is much easier to “grow” a smaller pot of funds than to grow a mammoth pot of funds![7]
It is well worth noting that there is a counter-point that the above report, prefaced by Buffett’s own (very helpful) explanation:[8]
 “Over the years, however, we have focused more and more on the acquisition of operating businesses. Using our funds for these purchases has both slowed our growth in investments and accelerated our gains in pre-tax earnings from non-insurance businesses, the second yardstick we use. Here’s how those earnings have looked:”
Those two charts offer a very valuable lesson regarding a key part of the financial dynamics (and metrics) that drive a large, diversified corporation like BRK-A — one that manages both a portfolio of operating companies and a portfolio of equity investments!
To me, more startling than any of the above graphs is the graph below… one of those “If only I had known then what I know now” charts:
 I was a sophomore in high school in 1965. If I had chosen to invest $1 in Berkshire Hathaway… the following would have occurred:
1) The broker would have fallen over in hysterical, howling laughter that a sophomore in high school was dumb enough to think he could invest $1 in anything!!
2) After settling the broker down and handing him a Prozac and a glass of water to settle him down… I would turn on my most convincing (and empathy inducing) charm.
3) I’d do everything I could to motivate him to consider my request as part of an “Educational Mission”:
a. He had succeeded in teaching me that I desperately needed an Investment Education!
b. He convinced me that $1 was not nearly enough… so I multiplied my “stake” by 1000%… and handed him a $10 bill!
c. This was now his opportunity to (by hook or crook) get me a $10 stake in Berkshire.
d. I’d report to him annually thereafter to review Berkshire performance!
e. This would be a “Win-Win” for all, since he could brag to other partners (and his friends) what a great and unselfish guy he really was!
Consider what my $10 would have been worth by 2006: $36,126!!
What would it be worth now? For conceptual purposes, let’s assume I re-invested all $36,126 into BRK-B shares on 1-2-2006. Since Yahoo.Finance.com shows the stock having appreciated by 118% since then, it would now be worth $78,755!
I can’t believe I didn’t have the good sense to have done just that!!!!!
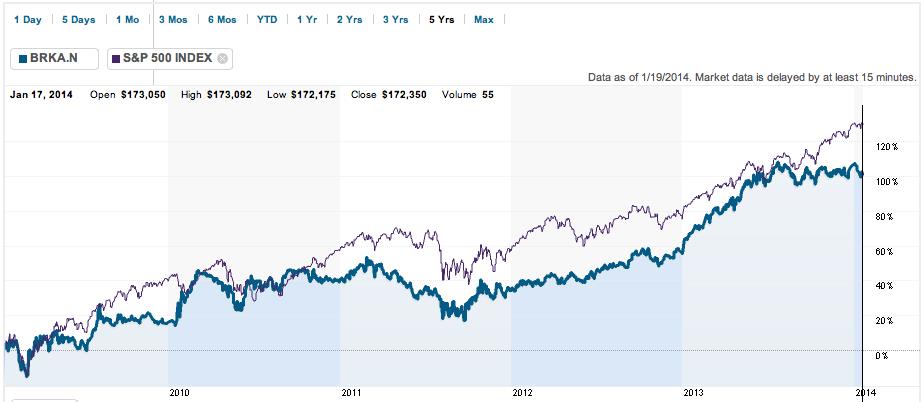
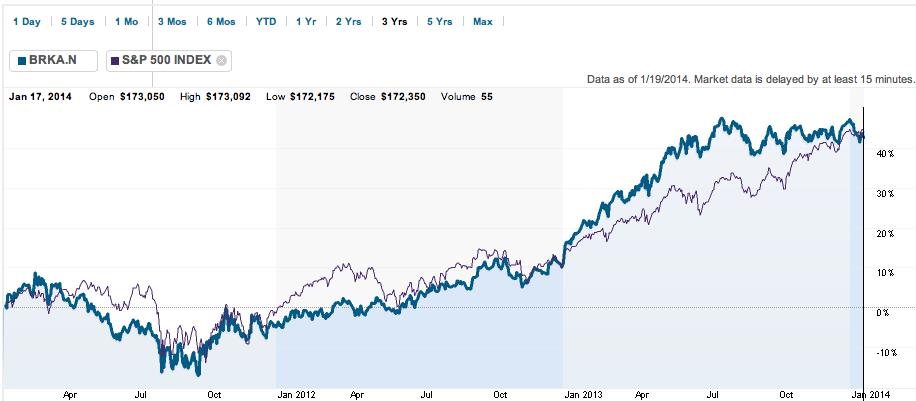
Over the past years, BRK-A has had a seesaw relationship with the S&P 500 Index. Over the most recent five-year period, the S&P 500 has edged out BRK-A by over 30% (see the Reuters graph below):
However, over the 3-year period, BRK-A outdid (barely) the Index:
Ironically, BRK-A has more clearly outperformed the Index during the most recent two years:
BUT…. during the most recent six-month timeframe… the S&P 500 Index has trounced BRK-A!!
It is absolutely imperative that, in the interests of full disclosure, I point out for you that there have been two particular years in BRK-A’s history during which BRK-A reported outsized UNDERperformance in the level of its Book Value/Share. Take a good look below at 1999 and 2009:
 For the 1999 year, the DIFFERENCE between the growth rate of the S&P 500 Index (21%) and BRK-A (0.5%) was a huge 20.5%!
Although the discrepancy was much more modest in 2009, it was still larger than either normal or expected, with the S&P 500 growing by 26.5% while BRK-A grew a mere 19.8%… for a 6.7% difference!
Let’s consider why/how Buffett has managed such a formidable and consistent outperformance of the S&P 500 Index over the past 58 years:
1) Cash Management and Risk Management
a. Buffett manages a huge insurance empire that generates excess cash like rabbits generate baby rabbits and bees on steroids would generate honey.
b. Buffett holds himself (and Charlie Munger) to strict discipline regarding the use of cash:
i. They only INVEST cash when the expected return from said investment meets the Buffett minimum standard.
ii. Piles of cash on hand do not bother Buffett; but poor performing investments do (decidedly) bother him.
c. Because of that CASH DISCIPLINE, when it appears that the world is going to hell in a hand basket and everyone is running scared[9], Buffett stands there (CASH in hand) to buy himself as many bargains as possible!
d. A corollary to c) above is the fact that, as “buyer” of last resort, Buffett is able to extract very attractive investment terms on such instruments as preferred stock and warrants– a strategy he used quite famously with regard to investments in a number of corporate stalwarts, including Goldman Sachs (GS), Bank of America (BAC), General Electric (GS), etc.[10]
2) A Portfolio Chosen According to a Coherent Investment Strategy
a. The S&P 500 Index is managed and adjusted on the basis of a huge list of criteria and metrics that do not even pretend to reflect a consistent, coherent strategy. Factors considered include: market cap, liquidity, sector grouping, corporate longevity, financial viability, liquidity, etc.
b. As stocks need to be replaced, a committee deliberates, dialogues, debates, and decides. And yes, we can be confident that politics and political correctness enters into the equation!
c. In sharp and stark contrast, it is Warren and Charlie (not a committee) decide where BRK-A cash is invested — strictly on the basis of company valuation and expected profitability, (and how that potential investment “fits” (or doesn’t fit) into the “big picture” of BRK-A).
d. Therefore, over time, it is a virtual lock that the quality (in the aggregate) of BRK-A companies will be superior (on an “apples to apples” basis) to the companies that compose the S&P 500 Index!
3) Superior “After-Tax” Investment
a. As we alluded to earlier, investors within the S&P 500 Index have investment income and capital gains related to her/his Index investment exposed to income tax every year.
b. Over time, that pares down and inhibits the full growth of capital.
c. Investors in BRK-A, on the other hand, only face a taxable event if/when he/she sells stock during any given year – and the tax rate applied is (generally) lower than the taxpayers standard “marginal tax rate”.
d. Therefore, more of that investor’s “capital” is kept working within a productive investment setting over a longer and steadier period of time.
Even though we can already anticipate the general magnitude of Buffett’s underperformance during the most recent five-year period, it will be fascinating to see the precise numbers reported by Mr. Buffett, as well as his observations about BRK-A, the Index, the Federal Reserve, and his expectations regarding the economy moving forward. I can guarantee you that “investment nuggets” will be contained within his report in abundance!
INVESTOR TAKEAWAYS: I do not and will not make investment recommendations. However, it is obvious that Warren Buffett is an exceptional investment strategist and manager. The average investor could do far worse than to invest assets within BRK-A.
In fact, I recently read an article within a publication (designed for financial professionals) that offered a report regarding a broker who was extremely frustrated by one very wealthy prospective client who had his entire portfolio invested within BRK-A! That individual was so ecstatic by Mr. Buffett’s consistent, dependable returns that he wanted nothing to do with this broker or his insistence that diversification was absolutely vital in every portfolio!!
Obviously, that particular wealthy investor was being foolish by totaling ignoring the time-honored and long-established investment principle of disciplined asset allocation (ie. diversification). However, that story serves as a great example of how convincing Warren Buffett and his long-term performance record can be for an investor looking for someone to trust!!
At any rate, BRK-A is quite worthy of consideration as a part of your investment portfolio – either as a core holding, or as a lower-risk trading vehicle.
I also suggest that you review (one more time) the significance of these two little slides (below) to which I referred earlier:
I grant that there are precious few corporations that come close to resembling BRK-A. That said, understanding the interplay of these two financial dynamics within such a corporate structure will be extremely beneficial to any shareholder of a Berkshire-like corporation!
Let me offer one final observation, based on the two charts (below). The almost two-year old ETF that is unabashedly based upon Warren Buffett’s Investment Strategy (Market Vectors Wide-Moat ETF (MOAT)) has been a great performer. I have written about it twice previously on this website.
However, during the course of its brief lifetime, MOAT has not been able to keep up with “the Oracle of Omaha” (BRK-B)!!!
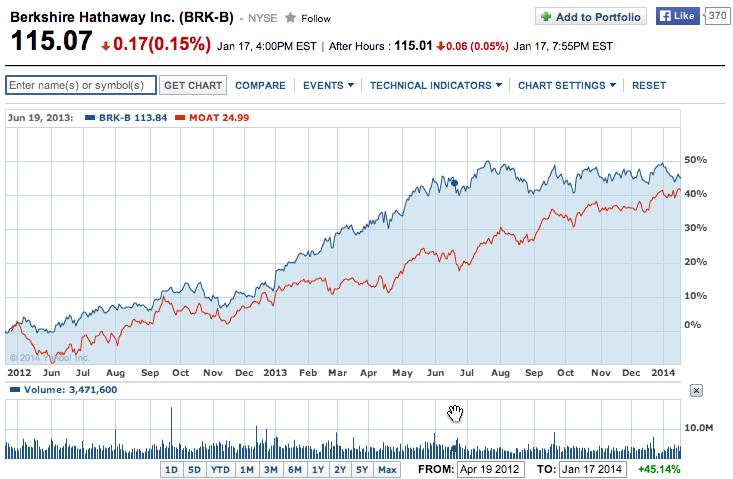 The above notwithstanding, it may be telling that, during the past 6-months, MOAT has outperformed BRK-B (by some 15%!)
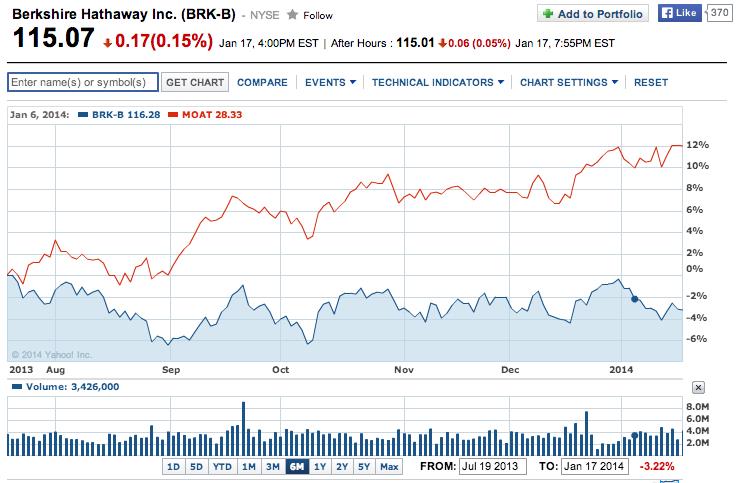 This could mean that MOAT has been outperforming its natural pace.
Or this might mean that BRK-B has been underperforming during the prior 6 months … and therefore is a more alluring “buy”.
Or it might not mean anything at all! However, these charts are most definitely worth considering in juxtaposition with one another!!
DISCLOSURE: The author has owned BRK-B…. but does not currently own it. He has (in the past) owned BAC, GS, MOAT, and GE; he currently owns none of them. Nothing in this article is intended as a recommendation to buy or sell anything. Always consult with your financial advisor regarding changes in your portfolio – either subtractions or additions.
[1] I specify “tournament play” to distinguish it from “no pressure” recreational rounds of golf.
[2] This means that the golfer would have to beat “Par” on a five-year rolling average basis!
[3] It is Jack Nicklaus’ major tournament win record that Tiger Woods continues to chase. For “Boomers”, Palmer, Player, and Nicklaus were golf’s “Big Three”!
[4] “Book Value” is simply “Assets minus Liabilities”, and Buffett’s metric is Book Value/Share!!
[5] If you have never read a Buffett shareholder report, you owe it to yourself to read one or more as soon as you can. He is candid (often criticizing himself for mistakes he has made). He is humorous. He is self-deprecating. He offers nugget after nugget of investing wisdom. And every time he refers to management, he does so by quoting “Charlie” (Munger) or referring to “Charlie and I”. It can sound like a “mom and pop” operation… but without “mom”.
[6] Per the top of page 3 of the BRK-A 2012 Annual Report.
[7] Here is Buffett’s explanation from the 2006 Annual Report: “In our early years we put most of our retained earnings and insurance float into investments in marketable securities. Because of this emphasis, and because the securities we purchased generally did well, our growth rate in investments was for a long time quite high.”
[8] Once again, from the 2006 Annual Report
[9] Such as in 2008-09!!
[10] Buffett profited by $2 billion from Goldman Sachs warrants he purchased in 2008.
Related Posts
Also on Market Tamer…
Follow Us on Facebook



 You Don't Need Talent to Succeed: Lessons From Warren Buffett's Lifetime of Investing
