Those of you who regularly consume financial media reports (print, TV/Radio, and/or Internet) have become extremely familiar with a basic axiom inherent within the fixed income market, namely:
Bond prices (the market value of any given bond) move inversely to bond interest rates.
During the most recent couple of years, financial experts have regularly forecasted the end of an extended (about 20-year long) “bull market” in bonds – on the very logical premise that extremely low interest rates would not likely remain so low. Therefore, expecting rates to increase, such experts urged investors to decrease allocations to fixed income securities because values were likely to fall!
By the beginning of 2013, with the “benchmark” U.S. 10-Year Treasury Bond yield at record low levels, these financial experts became so confident that rates would increase that it was difficult to watch CNBC, read Smart Money, or peruse the Wall Street Journal without a reminder of the danger inherent in bonds. In fact, UBS was so convinced that the bond bull market was over that it sent out a notice to all clients warning them that any client “overweight” in bonds would be classified by UBS as an “aggressive investor”! And of course, the iconic Warren Buffett issued his own unique style of warning earlier this year through his Berkshire Hathaway, Inc. (BRK-B) shareholder letter: “[Fixed income securities] are among the most dangerous of assets. Over the past century these instruments have destroyed the purchasing power of investors in many countries. Right now bonds should come with a warning label”.
Given the fact that I have only scratched the surface regarding “warnings” offered in the financial press about bonds, the results reported from an August survey by Edward Jones are rather remarkable. That survey shows that 63% of Americans do not know how rising interest rates will impact their 401(k), IRA, or Roth accounts!!
Recently, ProShares outlined the degree to which a $100,000 bond portfolio is impacted by rising rates. ProShares based their data on the bond metric of “modified duration”[1]. If that $100,000 portfolio had a duration of six years, a 1% increase in rates would reduce the portfolio value to $94,000. Much more dramatic, if the portfolio consisted entirely of 10-year U.S. Treasury Bonds (average duration of 9) a 2% increase in rates would reduce portfolio value to $82,000!! And of course, if an investor was careless enough to have a portfolio consisting entirely of 30-year U.S. Treasury Bonds (duration of 20) – that same 2% rate increase would reduce portfolio value to $60,000!
If ever there was a succinct, powerful argument for “diversification” within a bond portfolio[2], the above paragraph is surely that! In any event, the deleterious impact on bond prices since May (the 10 year Treasury rate moved from well under 2% to an intraday level over 3%) has gotten the attention of enough investors to cause huge outflows from bond ETFs and funds – 1) Since the first of August, well over $293 million came out of iShares 20+ Year Treasury ETF (TLT) and; 2) almost $400 has been pulled out of iShares Core Total U.S. Bond Market ETF (AGG). The fascinating thing about those outflows is the contrast between the relative magnitude of the flows vis-à-vis their respective durations: a) TLT’s duration is 16.31; while b) the duration of AGG is only 5.06. Therefore, the logical risk management choice would be to pull more money out of TLT than AGG.[3]
As we moved into September, several factors led to some stabilization within the bond market. One of the metrics that motivated increased demand for fixed income securities was the spread between the two-year and 10-year U.S. Treasury yields – which had moved all the way up to 2.55%. Since the historical high was just a bit higher (at 2.93%), many bond market watchers felt that the yield run-up had run its course (for now).
Of course, now that we have moved beyond the dreaded (and controversial) September Federal Reserve Open Market Committee meeting, bond rates have settled back a bit. But no one who rode the bond market waves between May and September enjoyed the tempest and tumult. In fact, such volatility within U.S. bonds has not been experienced since 1994!
Given all of the above, and the prospect (looking ahead) of Federal Reserve “tapering” beginning at some point (whether October of this year or June of 2014 – or anywhere in between), are there any insights we can glean from the past five months?
INVESTOR TAKEAWAYS: This article will offer you an “extended” set of takeaways – because all that I present below is, in one way or another, a potential source of investment data/insight for your use.
If you accept the premise that every investor needs to allocate a portion of her/his investable funds into bonds for purposes of diversification and portfolio optimization, then the question becomes: which type of bonds are most attractive in this environment?
Remember what we have learned so far:
1) Just as within equities, diversification is essential within the fixed income space;
2) Modified duration a key metric by which to discern bond risk in a period of rising rates;
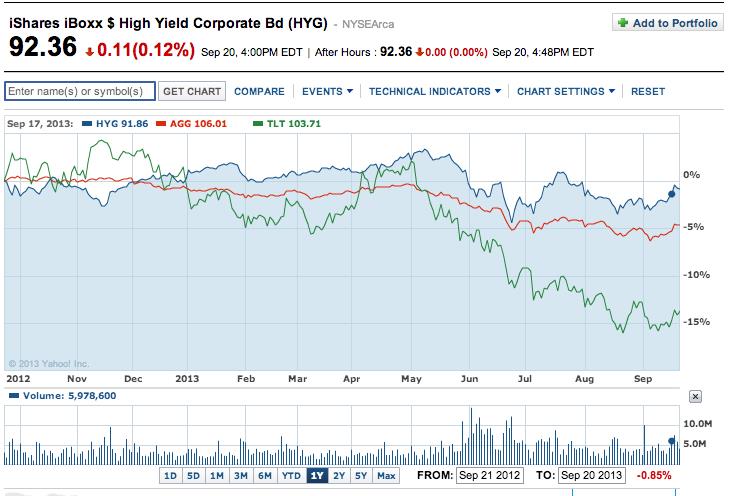
3) This next graph might surprise you. It contrasts the price performance of these ETFs:
a. iShares 20+ Year Treasury ETF (TLT) [in Green]
b. iShares Core Total U.S. Bond Market ETF (AGG) [in Red]
c. iShares iBoxx $ High Yield Corporate Bond (HYG) [in Blue]

4) Be honest now, when you read the names of those three funds, which one did you expect to be most volatile?
a. Based upon how the financial press usually describes the “High Yield” bond market, most would expect “High Yield” (HYG) to be the most volatile.
b. However, as you can see, HYG has outperformed year-to-date (YTD), edging out AGG by almost 5% and TLT by about 14%!
Here are some helpful facts about HYG: 1) Duration of 4.22 years (less than AGG and much less than TLT); 30-day SEC Yield of 5.56%. Another ETF option from within the same “corporate high yield” space is SPDR Barclays High Yield Bond (JNK). Comparable metrics for JNK are: 1) Duration: 4.45 years; 2) 30-day SEC Yield of 5.88%. Either one of these choices would be a potentially helpful addition to your list of “bonds to consider for my portfolio”!
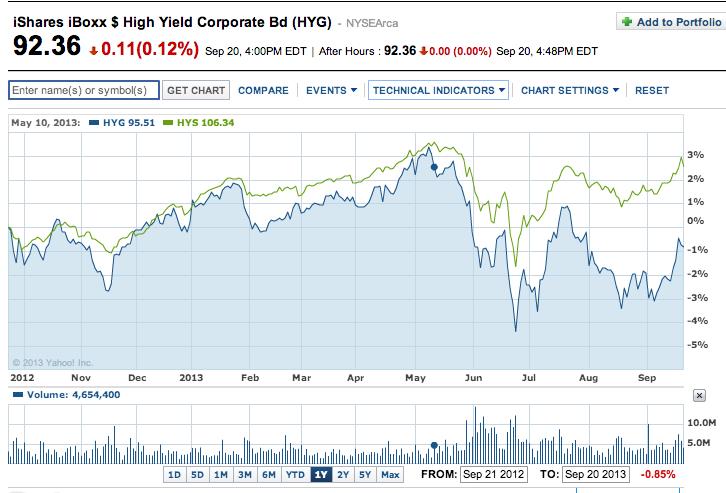
However, if your stomach becomes at all “queasy” as a result of the name or metrics involved with either HYG or JNK, then consider this alternative — PIMCO 0-5 Year High Yield Corporate Bond Index ETF (HYS)[in Green], contrasted in the graph below with HYG [in Blue]:

Pretty amazing, eh? HYS has outperformed HYG by close to 4% YTD!
In addition, the comparable metrics for HYS are: 1) Duration: only 2.03 years; and yet still offers a 2) 30-day SEC Yield of 3.70%!
Let me elaborate just a bit more on HYG and JNK. Each of those corporate high yield funds is a passively managed “index” fund. Each aims to replicate the index chosen by its manager as a benchmark. Those two funds are also the “biggest” in this space, which ensures exceptional liquidity.
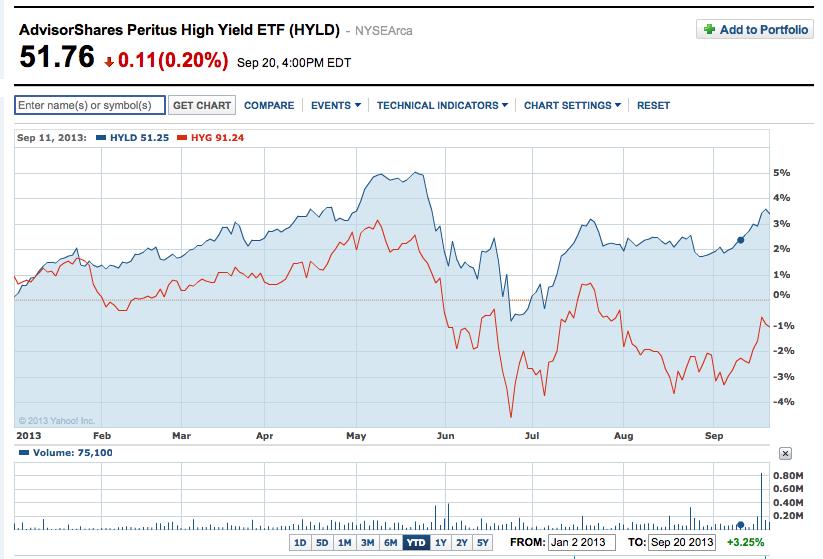
There is an actively managed alternative within this space: AdvisorShares Peritus High Yield ETF (HYLD)[in Blue] compared in the graph below with HYG [in Red]. As you can see, HYLD has outperformed HYG by about 4.5% YTD! Not too shabby!

Here are some key metrics from HYLD (as of 9/15/13):
1) Duration: 3.47 years.
2) 30-day SEC Yield: 8.35%.
3) Number of holdings: 72.
So what is the “secret” of HLYD?
It is “actively managed”. It has had to manage considerably less assets, giving it more discretion with regard to allocating cash to securities. It has created a portfolio with over ¾ of a year shorter duration, and about 2.5% higher SEC yield! In fact, if you compare HYLD with HYS, it is quite remarkable that HYLD pulls in about 4.65% higher yield while only extending duration by 1.44 years!
This outperformance has not gone unnoticed! While HYG and JNK have experienced net outflows during 2013, HYLD has received net inflows during 2013! In particular, on the Wednesday of the September Fed meeting, HYLD experienced record trading volume. The day’s volume more than doubled the previous high. Key Wall Street figures are taking increasing note of HYLD, such as the director of ETF execution services at WallachBeth Capital, Chris Hempstead, who noted that HYLD: “had some really nice inflows late in the day!”
Here are two final (related) observations: 1) Because of the position of high yield bonds within the corporate capital structure (very low), as well as its high yield and relatively “short duration”, HYLD, HYG, and JNK bear a bit more resemblance to equities than to bonds; 2) rising interest rates are not as large a part of the risk related to high yield bonds as is economic activity. Put more succinctly, many experts suggest that the biggest risk with high yield bonds is a recession. Therefore, (in theory) as the Fed sees increasing signs of a more sustainable recovery and begins to “taper” asset purchases, high yield bonds could be a preferable bond choice vis-à-vis more interest rate sensitive fixed income securities! However, whenever signs begin mounting of a new recession, an investor may be wise to reduce allocations to high yield (or eliminate such allocations completely!).
Allow me to offer a caution: if you find these ETF options appealing, you should think through any such allocations. No matter how impressive the metrics for any of these ETFs might be, do not (ever) “put all your eggs in one basket!” One possible strategy would be to allocate a blend of HYLD and HYS for that portion of assets you desire to invest within the corporate high yield space.
DISCLOSURE: The author owns HYLD, HYS, and HYG. He has owned options on TLT. Nothing in this article is intended as a recommendation to buy or sell anything. Always consult with your financial advisor regarding changes in your portfolio – either subtractions or additions.
Submitted by Thomas Petty MBA CFP
[1] Modified duration is the percentage change in bond price for a unit change in yield. It measures sensitivity of price to changes in yield.
[2] It is believed that more people understand the importance of diversification within stocks than understand the need for diversification within bonds. This paragraph should set them straight!
[3] AGG is a much more diversified portfolio than TLT! That accounts for the lower duration, and also illustrates quite powerfully the benefits of diversification!
Related Posts
Also on Market Tamer…
Follow Us on Facebook

 AMD: Solid Execution and AI Ambitions — but Can It Catch Nvidia?


