Archived Blog

The Week That Was: 6/15-19/2009

Posted June 21, 2009 at 12:54 AM

June 20th, 2009

The DOW broke through the bottom side of the flag pattern and pierced back through the 200sma on Monday and Tuesday and traded sideways to allow the index to touch the backside of the 200.  Even though price broke the 200, I still consider this to be a retest of the 200.  If the DOW breaks the swing low of 8461 from this past Wednesday, it will likely challenge the 50sma and the bottom of the shelf from most of May at 8221.  Immediate resistance appears to be at 8778 from the swing high on 6/11.  I don’t perceive this to be anything more than a profit taking pullback and then a resumption of the bullish move for a short while longer.

The SPX broke down out of the Bull Flag to form a Rounded Top and successfully retested the 200sma which was expected.  The 200 and 50sma are converging to form formidable support at 900.  Volume picked up on Friday’s session due mostly to Quad Witching.  We have a bullish stochastics crossover on the bounce off of Wednesday’s low.  This is nothing more than a profit taking pullback and we should rise once again to take another shot at the 956 level.

The COMPQ has led the way and will likely continue to be the leader of the pack.  We currently have an inverted cup and handle.  Key support on the chart pattern is the near lip of the cup at 1785.  We also have the recent gap from 5/29 and 6/1 which should also serve as strong support.  The 50sma resides at 1740 and is rising which should also act as solid support.  The immediate breakout level is at 1880 and then the bottom side of the gap at 1905 from 10/3/2008.  Again, I feel that we will continue to push higher for the short term.

Charts Week Ending 6/19/2009

Posted June 21, 2009 at 12:52 AM

6-20-2009-8-45-43-amindu

-

6-20-2009-9-00-44-amspx

-

6-20-2009-9-13-32-amcompq

Risk Graphs: Strip

Posted June 21, 2009 at 12:41 AM

June 20th, 2009


6-19-2009-2-58-40-pmstrip1

A strip is a non directional bearish bias long option play. It is comprised of one call and two puts with the same strike and expiration. One may actually structure the trade with a greater ratio of puts to calls depending upon how bearish the trader wishes to design the trade. The risk is the debit in the trade and the reward is theoretically unlimited. Study the risk graph and you will gain insight into the risk and reward of this position. Best, Robin

The Week to Come: 6/22/2009

Posted June 21, 2009 at 12:40 AM

ECONOMIC REPORTS

MONDAY 6/22

None

TUESDAY 6/23

Existing Home Sales

WEDNESDAY 6/24

Durable Orders, Durable Orders- ex Transportation, New Home Sales, Crude Inventories, FOMC Rate decision

THURSDAY 6/25

Initial Claims, Q1 GDP- Final

FRIDAY 6/26

Personal Income, Personal Spending, PCE Core, Michigan Sentiment-Rev

EARNINGS OF NOTE

MONDAY 6/22

SWHC, WAG

TUESDAY 6/23

CRMT, ORCL, SCS, KR

WEDNESDAY 6/24

BBBY, DRI, MON, NKE, RHT, RAD

THURSDAY 6/25

CAG, JTX, LEN, MU, PALM

FRIDAY 6/26

KBH, SJR

Commentary: A Trading Plan Template

Posted June 21, 2009 at 12:37 AM

June 20th, 2009

I have recently been working with several traders to help them improve their trading results and it became apparent to me that a vast majority of these traders did not have a trading plan.  I would suspect that this cross section sampling of traders is fairly representative of the larger group of retail traders.  Without a plan, you are destined to be pushed around by the whims of the market.  A lack of direction and continuity in your trading is the result of not having a plan.   Several of the people that I have spoken with have been trading for 20 plus years with spotty, inconsistent profits. 

 So, in an attempt to encourage you to realize the value of a trading plan, I have constructed a Trading Plan Template.  The template is comprised of a series of questions that are designed to make you think about your trading as a business.  Trading is, in fact, a business.  If you enter into business without a business plan you are setting yourself up for failure.  I hope that it gets you started in the right direction.  Best, Robin

Trading Plan Template

General

·     My Trading Day – Outline my typical day and the procedures I follow.

·     What Time Frame(s) Do I trade? – My approach will vary depending upon the timeframe.  Explain.

·     How Much Time Am I Willing To Spend in My Trading Business?

·     What is My Time Horizon – am I trading for monthly income or am I trading for growth and when will I need the money.  Explain.

·     Do I have a thorough understanding of the risks involved with trading?  Explain.

·     Do I have a clear understanding of my risk tolerance?  Explain.

                       My Account

·     How large is my account and what percentage of my account am I willing to put at risk?

·     Is my account qualified or non-qualified.  (IRA or Regular)

·     How will I allocate my capital? (diversification and position sizing)

·     Who is my broker?  Is this the best choice for me?

                     Trading Goals

·     Outline my specific goals and objectives and present justification as to how I am to reach these goals.

·     What strategies and methodologies will I implement in order to achieve my expectations?

·     Do I have the knowledge required to implement the aforementioned strategies?

·     If I am lacking in that knowledge, what is my plan to acquire that knowledge and experience?

                   Account Management

·     What is my plan for capital preservation?

·     When will I make my trading decisions?  (During market hours or end of day)

·     What is my process for performing my due diligence and when will that due diligence be done?

·     Do I have clear and precise entry and exit criteria? Explain.

·     What is the maximum number of positions that I can effectively manage at any given time?

·     Will my time allocation and strategy implementation allow adequate time to monitor my open positions? Explain.

·     Do I keep a daily anecdotal journal to record my trades as well as my emotional response to the trading activity?  Explain.

·     What is my procedure for managing my open positions?

                  Psychology of Trading

·     Is my psychology well balanced regarding the market and how it integrates with the rest of my life?

·     What are my strengths and weaknesses?

·     Have I designed a plan to reduce or eliminate my weaknesses? Explain.

·     Do I have a trading partner(s) to exchange ideas with and to hold each other accountable to our respective trading plan?

·     Have I planned periodic vacations from the trading business?

·     What is my plan for the Market while on vacation?

                       Miscellaneous

·     Do I have a continuing education plan?

·     Who are my resources for assistance?

·     Do those closest to me support my efforts in the Stock Market?

                        Plan Summary

·     Summarize the plan.  The plan must be a “Living, Breathing Document” that will be strictly adhered to.  Include a list of trading rules that must not be violated.

The Week That Was 6/8-12/2009

Posted June 12, 2009 at 6:13 PM

June 12th, 2009

The SPX continues to go sideways right at the 944 swing high from 1/6/2009.  We have a Bull Flag that moved through the 200 SMA on June 1st and has essentially flattened out since then.  The current breakout high from the flag is yesterday’s high of 956.  A break and close below the 200 SMA and then subsequently the 50 SMA would portend a bearish trend reversal.  930 and 875 are key support levels.  Don’t try and guess direction coming out of a consolidation pattern.  Just wait for the market to commit to a direction and play it accordingly.     

The DOW ended the week with its 9th narrow range, flat session in a row.  Volume has been decreasing which confirms the lack of short term interest in taking the index higher.   Both the SPX and the DOW are poised to go higher as soon as they poke their heads above the high in the flag with some convincing volume.  The 200 SMA has acted as solid support for the DOW with the next stop on the ‘Bull Train’ at 9088, the swing high from 1/6/2009.   The SPX is targeted for 1007.

The COMPQ looks like it’s forming a rounded top just shy of resistance at the gap at 1905 from 10/6/2008.  This index has been the leader since the March lows and I don’t anticipate that changing.  Look for the index to challenge 1905 soon.

Week over week, the DOW was up 36, the SPX better by 6 and the COMPQ increased by 10.  

Charts Week Ending 6/12/2009

Posted June 12, 2009 at 6:11 PM

June 12th, 2009


6-12-2009-4-55-00-pmindu

6-12-2009-5-04-56-pmspx

6-12-2009-5-14-11-pmcompq1

Risk Graphs: Covered Short Strangle

Posted June 12, 2009 at 6:09 PM

June 12th, 2009


6-12-2009-4-10-43-pmcovshortstrangle

The Covered Short Strangle is the ‘Kissin Cousin’ to last week’s strategy, the Covered Short Straddle.The Covered Short Strangle is also a high risk limited reward strategy.  However it is somewhat less risky than its counterpart.  The difference between the two is that the Covered Short Strangle’s long options are placed OTM at different strikes.  In a bullish move, the position will allow for more stock appreciation than the Covered Short Straddle and the short put is further away from price so it is more likely to expire worthless.  The risk graph is almost identical to the Covered Short Straddle.  One could think of the position as an OTM Covered Call with an added OTM naked short put.

Review the risk graph and you should gain understanding of the risk and reward of the position.  Best, Robin

The Week to Come 6/15-19/2009

Posted June 12, 2009 at 6:08 PM

June 12th, 2009

ECONOMIC REPORTS

MONDAY 6/15

NY Empire Manufacturing Index, Net Long Term TIC Flows

TUESDAY 6/16

Building Permits, Core PPI, Housing Starts, PPI, Capacity Utilization, Industrial Production

WEDNESDAY 6/17

Current Account Balance, Crude Inventories

THURSDAY 6/18

Initial Claims, Leading Indicators, Philadelphia Fed

FRIDAY 6/19

None

EARNINGS OF NOTE

MONDAY 6/15

CPST, CASY

TUESDAY 6/16

ADBE, BBY

WEDNESDAY 6/17

FDX

THURSDAY 6/18

SJM, PIR, RIMM, WGO

FRIDAY 6/19

KMX

Commentary: Paralysis of Analysis

Posted June 12, 2009 at 6:05 PM

June 12th, 2009

It is critical to do your Due Diligence.  There is no question about it!  You need to know the fundamentals of a stock prior to trading.  You also need to know that the technical’s are favorable for entry.  However, after your homework is completed, do you still have difficulty ‘pulling the trigger’?  You may be suffering from ‘Paralysis of Analysis’.  At some point, you will need to put money at risk if you want to make money in the market. 

Your reluctance is due to fear that can actually be exacerbated by an avalanche of data.  Much of that aforementioned data can be conflicting and confusing.  The preponderance of due diligence should lead you to make a trading decision, but sometimes that decision may prove to be a bad decision.  That is what creates ‘Paralysis of Analysis’; which is really just a synonym for fear.  Fear is only half of the dastardly duo known as ‘Fear and Greed’.  Fear comes into play due to uncertainty.  There is only one metric that is for certain in the stock market and that is, time will pass.  As a stock and options trader, I can leverage that by selling premium.  But even as a premium seller, there can be uncertainty which can deter the timid trader from entering the market. 

Knowing how to adjust trades is the anecdote for ‘Paralysis of Analysis’. That knowledge removes uncertainty which allows the trader to enter a position without the crippling effects of the emotion of fear.  Fear is the byproduct of uncertainty and because you know how to change the trade to optimize a change in trend, you have nothing to fear.

       Best, Robin

The Week That Was 6/1-5/2009

Posted June 6, 2009 at 5:55 PM

June 6th, 2009

Robin (aka Mark Espy) is Back!!!  I have recently taken some time off to recharge my batteries and my trading partners have filled in with some outstanding content. 

The market continues its journey higher, although we have recently been bouncing off of the 994 swing high on the SPX from 1/6/2009.  In order to continue the run, we need greater market participation as evidence by increasing volume. 

It’s good to be back.   Take a look at the charts and my comments as well as my commentary on ‘Trend Following’.  

We came out of the gate quickly in June posting a 221 point gain in the DOW.  Personal Income numbers contributed to the bullish sentiment along with positive ISM figures.

Tuesday saw the NAR report the third consecutive month of increased existing home sales.  Ford’s drop in car sales was not as severe in May as predicted which was a surprise.  The DOW notched a nominal 19 point gain.

Wednesday, ADP numbers disappointed with more than 500,000 lost jobs.  Although improving month over month, the number was larger than expected.  The DOW retraced 66 points.

Thursday, unemployment claims improved, retailers posted spotty ‘Same Store Sales’ and bank stocks pushed higher.  The DOW finished 75 points higher.

Friday, the DOW eked out a small 13 point gain.  Non-Farm payrolls posted better than expected numbers but was offset by a 9.4% unemployment rate.  The dollar rose amidst concerns of inflation.  Speculation surfaced that the Fed might consider raising interest rates in order to stem the tide of future inflation.

Week over week the DOW was up 263, the SPX better by 21 and the COMPQ increased by 75.

Charts Week Ending 6/5/2009

Posted June 6, 2009 at 5:50 PM

June 6th, 2009

6-6-2009-8-14-36-amcompq

6-6-2009-7-44-16-amdji11

6-6-2009-7-59-51-amspx

Covered Short Straddle

Posted June 6, 2009 at 5:48 PM

June 6th, 2009

6-5-2009-1-44-48-pmcoveredstraddle2

This is a high risk, limited reward strategy. The position incorporates three trading instruments 1) a short call 2) a short put and 3) long stock. The short call and short put are sold to open at the same strike and expiration month, usually with 30 days or less to expiration. The long stock covers the short call obligation but the short put is naked. The position is less risky than the short straddle (see April 11th article) because of the addition of long stock.
The expectation is for the stock to remain stagnant or move bullish. Another way to think of the position is an ATM covered call with a naked short put in order to enhance the short option premium. The naked short put is the synthetic equivalent of a covered call, so the risk graph is identical to the covered call. Study the risk graph and you should gain understanding of the risk and reward associated with the position. Best, Robin

The Week to Come: 6/8-12/2009

Posted June 6, 2009 at 5:38 PM

ECONOMIC REPORTS

MONDAY 6/8

None

TUESDAY 6/9

Wholesale Inventories

WEDNESDAY 6/10

Crude Inventories, Treasury Budget, Fed Beige Book

THURSDAY 6/11

Retail Sales, Retail Sales Ex-auto, Initial Claims, Business Inventories

FRIDAY 6/12

Export Prices Ex-ag, Import Prices Ex-oil, Michigan Sentiment


EARNINGS OF NOTE

MONDAY 6/8

FCEL


TUESDAY 6/9

PBY, PNY, SINA, TLB

WEDNESDAY 6/10

MW

THURSDAY 6/11

NSM

FRIDAY 6/12

None


Trend Following

Posted June 6, 2009 at 5:32 PM

We often hear investors talking about TREND FOLLOWING.  Some of the most successful investors in the history of the market have been Trend Followers, but how do you do it?  It seems that many traders today are involved with smaller time frames and sometimes lose the larger perspective.  In today’s market, it seems to be easy to get caught up in the mentality of what’s happening in the next minute.  Don’t get me wrong, there are plenty of people who do well in that time frame, but my feel is that trading in 1-10 minute charts can be stressful, time consuming and for many, unprofitable.  I am simply not wired for that kind of trading; kudos to those that are.  I would rather take a longer trip without frequent stops along the way.  In other words, ‘Follow the Trend’. 

My initial market call for a bottom was February 28th and I reiterated my call one week later on March 7th (see chart analysis of February 28th and March 7, 2009).  Since that point, we have risen 35%.  Throughout this ascent, some traders have second guessed the move and gone short at various intervals trying to time a retracement. The market has given us no reason to consider exiting.  Even now in the recent consolidation, the charts have not indicated a trend reversal. From my own perspective, I have been bullish since early March and continue to be so until the charts tell me otherwise.  Granted, the slope of the recent ascent has diminished, but as long as we continue to make higher highs and higher lows in an ascending channel and no break below the current consolidation, I will remain long.

I am following the trend until it ends.  It ends when the market says that it ends and that will be reflected in the charts.  It is fun to speculate on the direction of the market and predict tops and bottoms.  I have been fortunate to be able to have some success doing that, however, the easier way to play the market is to let the market commit itself to a direction first and then hop on board for the ride.  Stay on board until the conductor says that we’ve reached the station.  You will know that the trip is over when the train begins to slow and passengers begin to gather up their luggage.  Be careful, it might just be a whistle stop.  The only surefire way to know it’s over is when the northbound train has arrived and the southbound is pulling out of the station.  You might not get out right at the top but you will catch the belly of the trade if you wait again for the market to commit itself to a new direction and ‘Follow the Trend’.     

Theatre Of The Absurd

Posted May 29, 2009 at 9:32 PM

Just a quick blog update on what Peter Schiff describes as the Theatre of the Absurd.  And what is this theatre?  It is the policy of the Federal Reserve buying TIPS, which are 'inflation-protected' securities.

Schiff asks the question "When TIPS were created, did anybody think that the Federal Reserve would be printing money to buy the TIPS?"  He goes on to ask the ironic question "Why does the Fed need protection from itself?" And since the "Fed creates the inflation, why does it need the protection?"

Perhaps the greatest irony is that as they print money to buy TIPS, they create the very inflation that is causing people to want to prefer TIPS over Treasuries. 

TIPS are indexed to the CPI, which is subject to substitutions thus distorting true inflation figures.  As a result, true inflation protection is rendered better through gold.

Biggest Risk

Posted May 28, 2009 at 11:08 AM

An interesting interview with Sam Zell on Bloomberg earlier today where the real estate mogul noted that the biggest risk to the economy was the scale of government debt married to the creation of all the programs all at once.  He commented that "nobody knows the consequences of this debt".

Further in the interview he switched to the newspaper industry.  Recently Buffett commented that no paper in the United States was worth purchasing at any price!  Sam Zell's position was very similar, commenting how his Chicago Tribune purchase was a mistake.  And he noted that cost structures are unsupportable while revenues have diminished.

Paradigm Shift

Posted May 27, 2009 at 7:22 AM

The equity markets may continue higher in nominal terms but that doesn't necessarily mean the real economy is improving.  Theoretically, if enough money is printed, the market could even reach new highs!  The market prices will grab the headlines but they veil what should be of greatest concern: real growth. 

The printing of enormous amounts of money is a fundamental event that can lead to higher prices.  Just because other more obvious factors, such as industrial production, home prices and so forth cannot be identified as causes for a market rally does not mean no fundamental factors exist.  The policy of the Federal Reserve has an overarching impact.

Essentially, the creation of money can lead to a boom in the short-term which is why some months ago we noted that a paradigm shift may have occurred and, in spite of economic weakness, the market could continue to power higher.  Such a boom is never lasting because its origination is not from production but contrived through monetary policy. 

So, what will be the result of printing so much money?  Increased volatility.  Volatility is exceedingly difficult for most traders to manage.  However, mastery of options facilitates risk hedging strategies and greater control. 

Moves of 30%-40% over the course of year will not be uncommon and has already been evident twice in the first half of 2009.  We're here to help you master options trading so don't hesitate to ask us questions.

The Perfect Covered Call?

Posted May 26, 2009 at 2:38 PM

Market Tamers - one of your fellow members, Barry B, has kindly allowed me share his approach to covered call writing below, which I am sure you will find helpful. 

The basis of the methodology comes from Alan Ellman's book "Cashing In On Covered Calls"
Since the method starts with the IBD100...a good source for stocks with near term strength.


[1]  Eliminate any stocks that are not optionable

The "Smart Select" ratings are the new/updated ratings from IBD
The "Smart Select" ratings are 6 metrics (proprietary I believe)...Overall plus 5 fundamental and technical ratings
These are displayed with both a numerical rating and a Red, Yellow, or Green indicator...or "dot"
These are displayed when you enter the stock symbol on their premium website.


The quote page is different than the "Stock Check-up" page
The "Smart Select" ratings are a subset of the ratings on the "Stock Check Up" page
The method only selects stock with "6 green dots"...the highest rating in each category

An enhancement that I added is to run the optionable, 6 "green dot" stocks through Louis Navellier's "Stock Grader Pro" screener
This is a free site that allows you to screen stocks according to Louis Navellier's criteria...primarily  a growth focused screener

Navellier uses a combination of quantitative and fundamental metrics.

I use only stocks that rate an "A" in both "Total Stock Grade" and "Quantitative Grade".

The surviving stocks are then passes through MSN's StockScouter" which gives a risk/reward metric for the stock relative to the market in general

The ratings are from 1 to 10, with 10 being the highest rating I keep only stocks that are 6 or greater...Alan Ellman's method accepts stocks that are 5 or greater.

The remaining stocks are then charted using the free charting tool from StockCharts.com.

I have been using OHLC bars, but at the recommendation from Ron, I will change that to Candles.

I use a 7 day EMA, 20 day EMA and 100 day EMA charts.  The 7 day EMS is my enhancement.

I want to see all of the EMAs "stacked up".

Price is at or above the 7 EMA
7 EMA is above the 20 EMA
20 EMA is above the 100 EMA
MACD is between 20 and 80 and uptrending.  Slow Stochastics is between 25 and 75 and uptrending

At Ron's suggestion I'll use Full Stochastics, RSI above 50
If a stock passes all of the filters, I won't do a CC transaction if the stock is reporting earnings during the current option month, but will keep it on my watch list.

I typically buy stock in 500 or 1000 share lots inn order to get decent cash from selling the calls.

I will incorporate your suggestion of looking at the S&P 500 chart as well

Note:  I have also suggested that Barry pay close attention to earnings announcements, rates of return and risk.

North Korean Nuclear Tests

Posted May 25, 2009 at 9:43 PM

Originally, this article was intended to be a market forecast section, but world events have taken precedence.  North Korea has completed nuclear tests which are initially impacting futures.  Until the full extent of the tests are known, we believe it is imprudent to make any assertions. 

This decision originates from one of our trading rules, which is that fundamental news event take precedence of technical analysis.  In short, it doesn't matter what the charts say when a 'Black Swan' type event takes place. 

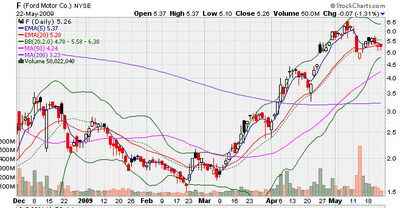
For those of you who are picking and choosing positions, we are downgrading our bias on Ford to stable-negative.  The chart below is not projecting strength.

fordchart_400

As seen on...